ResidentialBusiness
Administrators
-
Joined
-
Last visited
Everything posted by ResidentialBusiness
-
President touts his friendship with Xi Jinping and future opportunities for his entourage of US business titansView the full article
-
One of the main appeals of a Chromebook is its simplicity: You've essentially just got a row of browser tabs, running web apps, with minimal background activity going on and everything instantly saved and synced to the cloud. As Chromebooks have developed though, they've add more to this basic Chrome foundation. They can run Android apps now, for example, and they actually come with several pre-installed apps that are genuinely useful. Open up the Launcher (the Google icon, bottom left), to see what's available. These are the best built-in apps you get right now, if you buy a new Chromebook Plus model—that's the slightly higher spec series, capable of supporting all the Gemini AI extras that Google has been pushing out in recent years. Recorder Recorder offers simple recordings and transcriptions. Credit: Lifehacker This is perhaps my favorite of the built-in ChromeOS apps. It's a powerful voice recorder and transcription tool, similar to Recorder on Pixel phones, and it's really simple to use: Click the record button, start speaking, and you're up and running. You'll need to download a couple of extra AI models to your Chromebook, but once you do, you can have speech transcribed into text immediately, and get AI-powered summaries and titles for your clips too. What's more, the app will identify different speakers if you want it to, and apply the correct labels based on voice speech patterns and style. All of your recordings can be easily accessed within the app, and shared elsewhere as and when needed. Screencast Screencast lets you save and share screen recordings. Credit: Lifehacker Screencast is a great tool for screen recording, and you can opt to include your webcam video and microphone audio as needed too. Whatever you're needing to share from your Chromebook display, Screencast enables you to do it. Recording is straightforward, and handled via icons on the shelf at the bottom of the interface—there are annotation tools here too, if you need to draw on the screen. When you're done, any speech is automatically transcribed for you. There are even some basic editing tools included here, so you can trim out unnecessary portions of your presentation or tutorial (or whatever it is). You can share your screencasts with others via customized links, as well. Text Text is a basic text editor and works offline. Credit: Lifehacker You don't always necessarily want to create an entire Google Doc or even a Google Keep note to jot ideas down, and that's where Text comes in: It's a basic, local text editor, the equivalent of Notepad on Windows or TextEdit on macOS. There are a few handy features here, behind the plain interface. You get syntax highlighting for a variety of programming languages, configurable font and tab sizes, and a simple search function. You've also got light and dark modes to choose from. Importantly, it can work completely offline, so it's ideal for distraction-free writing or coding when you don't want to have a dozen browser tabs open (or if you lose a wifi signal and need to remember something quickly). Key Shortcuts Key Shortcuts lets you edit keyboard shortcuts as well as view them. Credit: Lifehacker Keyboard shortcuts are among the best productivity hacks for getting more done in a shorter space of time, and Key Shortcuts lets you view all of the shortcuts available on ChromeOS—from opening notifications to changing the screen zoom. This app is more than just a list of shortcuts, though: You can actually customize many of the shortcuts yourself, via the pencil icon that appears on the right as you hover the cursor. Don't like the full-screen screenshot shortcut? Change it. You will be limited in terms of certain keypresses, and the dedicated keys (for volume, for example) that are available on your particular Chromebook model, but Key Shortcuts gives you plenty of flexibility as well as being a handy reference. Gallery Gallery lets you work with images, video, audio, and PDFs. Credit: Lifehacker Last but definitely not least, we have the excellent Gallery app. This is where you can edit images and PDFs, watch videos, and listen to audio. Each of the different components is relatively basic, but they all work well, and all work offline too. With the image editor, for example, you can crop, rotate, and resize pictures, as well as annotate them with a variety of pen sizes, styles, and colors. There are also basic adjustments available for exposure, contrast, and saturation. The PDF editor covers some of the main operations you might want to carry out on documents like these: Adding text, annotating pages, and inserting your signature. You can also get AI summaries of PDF documents. View the full article
-
Michaels is expanding its party supply and celebration offerings. In September 2025, the arts and crafts retailer introduced The Party Shop at Michaels, an in-store shopping experience that brought party supplies, balloons, and other celebration essentials to its shelves. This year, its product selection will grow even further. In a May 13 press release, Michaels announced it is expanding its in-store party supply assortment and introducing new in-store experiences, with plans to add nearly 600 new products to its shelves throughout 2026. Michaels isn’t the only unexpected retailer with a party supply aisle. Last month, Staples announced it was getting into the party business with help from Party City. The office supply retailer shared plans to add Party City at Staples shop-in-shops to more than 700 of its stores. Party City filed for bankruptcy for a second time in December 2024 and announced it would close all of its stores. Its departure left many shoppers without a go-to retailer for party supplies and balloons. In the wake of its store closure, retailers like Staples and Michaels are filling the gap. Michaels offers new ways to prepare for your next party In the past year, Michaels has expanded its party supplies and balloon offerings to over 4,500 products. The retailer isn’t slowing down—it plans to add around 600 new products by the end of 2026, bringing even more celebration finds to shelves. New products include piñatas, expanded licensed essentials featuring characters like Hello Kitty and Bluey, and year-round entertaining products. Michaels is also introducing new in-store experiences. Beginning this month, the craft retailer is rolling out the following in-store DIY customization bars across North America: The Favor Bar: Mix and match items to build custom party favors. The Candy Bar: Fill favor bags or create dessert displays with an assortment of sweets. The DIY Banner Bar: Create personalized felt banners with interchangeable numbers, letters, and icons. And for those who need gift wrap, Michaels will have an assortment of gift wrap and bags, bows, tags, and tissue paper—customers can mix and match five items for $5. “At Michaels, we believe the joy of celebrating should begin the moment you start planning,” David Boone, CEO of Michaels, said in a statement. Shop-in-shops are the latest way retailers are expanding The Party Shop at Michaels isn’t the only in-store shopping concept that the craft retailer offers. Last year, Michaels also welcomed The Knit & Sew Shop. The shop features Joann and Michaels-branded sewing and crafting essentials like yarn, thread, and fabric. In 2025, the arts and fabrics chain Joann Inc went bankrupt and closed all its remaining stores. In June 2025, Michaels acquired Joann’s intellectual property and private label brands. Shop-in-shops like The Knit & Sew Shop and The Party Shop at Michaels allow retailers to expand their offerings and appeal to a wider customer base without expanding their physical footprint by opening new stores. Both Michaels and Staples are privately held companies after formerly being publicly traded. The Michaels Companies was taken private in 2021 by Apollo Global Management. Staples Inc was bought in 2017 by Sycamore Partners. View the full article

-
European nations swing behind idea discussed with Riyadh to model agreement on 1970s Helsinki processView the full article
-
Presidents Xi Jinping and Donald The President started a crucial series of meetings in Beijing on Thursday in a U.S.-China summit where stability in the relationship is the main goal of the two days of discussions. The White House and Chinese state media said the leaders concluded their meeting Thursday morning after about two hours. The President is expected to leave just after midday Friday after a final private meeting with Xi. But few breakthroughs are expected on divisive issues ranging from the Iran war, trade, technology and Taiwan. The President hopes to focus the summit talks on trade and deals for China to buy more agricultural products and passenger planes, setting up a board to address their differences and avoid a repeat of the trade war ignited last year after The President’s tariff hikes. In their closed-door meeting, Xi told The President that if Taiwan is handled well, U.S.-China relations “will enjoy overall stability.” If not, the two countries risk “clashes and even conflicts, putting the entire relationship in great jeopardy,” Xi said, according to China’s official Xinhua News Agency. The President in December authorized an $11 billion arms package for Taiwan, a self-governed island that Beijing claims as its own territory. The U.S. has not yet moved forward with delivery. Xi said China’s door of opening to U.S. business will only open wider, he told American corporate leaders who accompanied The President. The U.S. president said the business leaders all respect and value China and he encourages them to expand cooperation with China, Xinhua reported. The war with Iran is also likely to be a key topic. Ahead of the meetings, The President hoped China would use its considerable leverage to prod Iran to agree to U.S. terms to end the two-month old war or reopen the critical Strait of Hormuz, but he has tempered those calls ahead of the summit. —Associated Press View the full article

-
Grasping the benefits of customer loyalty is essential for your business’s success. Loyal customers not just stay longer but likewise spend considerably more than new ones, which directly impacts your profits. They often share their positive experiences, enhancing your brand’s visibility through word-of-mouth. Furthermore, these customers provide insights that can refine your offerings and strengthen your market position. Exploring these advantages can lead to strategic decisions that nurture long-term growth and sustainability. Key Takeaways Increased customer retention can significantly boost profits, with a mere 5% increase elevating profits by 25% to 95%. Loyal customers spend 67% more than new customers, enhancing revenue stability and profit margins. Word-of-mouth referrals from satisfied customers can reduce acquisition costs by up to 50%. Strong customer loyalty fosters brand advocacy, as loyal customers are more likely to recommend your brand. Engaging loyal customers provides valuable insights and feedback, informing business improvements and marketing strategies. Increased Customer Retention When businesses prioritize customer retention, they not merely save on acquisition costs but in addition improve their overall profitability. Why is customer loyalty important? Retaining existing customers is five times cheaper than acquiring new ones, making it a cost-effective strategy. A mere 5% increase in customer retention can boost profits by 25% to 95%. Loyal customers are also 50% more likely to try new products, creating broader sales opportunities. Moreover, customers with strong loyalty exhibit a 14 times higher likelihood of making repeat purchases compared to new customers. Implementing loyalty programs can improve retention rates considerably, with 77% of consumers stating they’re more likely to stay with brands that offer such programs. These benefits of customer loyalty demonstrate its crucial role in business success. Enhanced Customer Lifetime Value Improved customer lifetime value (CLV) is a vital metric that reflects the total worth a customer brings to your business over the duration of their relationship. Focusing on customer loyalty can greatly improve this value, as loyal customers are worth 306% more than non-loyal ones. Here are three key factors to contemplate: Retaining just 5% of your customers can increase profits by 25% to 95%, making loyalty essential for maximizing CLV. Loyal customers usually spend 67% more than new customers, boosting your average order value. Long-term relationships nurtured by loyalty programs create stability in sales, ensuring a steady revenue stream. Boosted Word-of-Mouth Marketing When you create loyal customers, you’re tapping into a formidable marketing tool: word-of-mouth recommendations. These satisfied customers aren’t just 77% more likely to share their positive experiences, but their endorsements carry more weight than traditional ads, leading to greater trust. Amplified Brand Recommendations How can customer loyalty greatly improve brand recommendations? When customers are loyal, they become enthusiastic advocates for your brand. This enthusiasm translates into recommendations that profoundly impact your business. Here are three key benefits: Increased Referrals: Loyal customers are 77% more likely to recommend your brand after a positive experience, boosting your word-of-mouth marketing efforts. Trusted Endorsements: Approximately 47% of consumers show loyalty by recommending brands they trust, and these endorsements carry more weight than traditional ads. Cost Efficiency: Word-of-mouth referrals from satisfied loyal customers can lower your acquisition costs, as authentic endorsements resonate better with potential buyers. Trustworthy Organic Endorsements Building on the enthusiasm generated by loyal customers, trustworthy organic endorsements play a pivotal role in enhancing word-of-mouth marketing. When loyal customers have a positive experience, they’re 77% more likely to recommend your brand to friends. These recommendations carry 92% more credibility than traditional advertising, making loyal customers influential advocates. Approximately 47% of consumers share their positive experiences, driving organic growth through authentic endorsements. Additionally, word-of-mouth referrals can lower your customer acquisition costs by up to 50%. Brands with strong customer loyalty enjoy increased visibility, as satisfied customers often amplify their positive experiences on social media. Improved Brand Trust and Advocacy When you build loyalty with your customers, you improve their emotional connection to your brand, which can lead to increased trust and advocacy. Loyal customers are more likely to recommend your products to their friends, driving valuable word-of-mouth referrals that traditional advertising can’t match. This not just boosts your brand visibility but additionally nurtures long-term relationships that keep your customers engaged and less likely to switch to competitors. Enhanced Emotional Connections Emotional connections play a crucial role in enhancing brand trust and advocacy, as they directly influence customer loyalty. When you cultivate these connections, you can expect the following benefits: Increased Loyalty: Emotional ties can lead to a 26% rise in true loyalty, translating into stronger advocacy for your brand. Higher Spending: Loyal customers are 50% more likely to try new products and spend 31% more than new customers, demonstrating that trust encourages greater purchasing behavior. Reduced Price Sensitivity: Brands with emotional connections can mitigate price sensitivity, as loyal customers prioritize trust over competitive pricing, making them less likely to switch for cheaper options. Increased Word-of-Mouth Referrals Customer loyalty greatly improves word-of-mouth referrals, which can profoundly impact your brand’s reach and reputation. When customers have positive experiences, they become 77% more likely to recommend your brand to friends, considerably enhancing your visibility. In addition, about 47% of loyal customers are inclined to share their experiences, acting as trusted advocates for your brand. This organic word-of-mouth marketing can streamline customer acquisition, lowering your marketing costs and allowing you to allocate resources more effectively. Recommendations from satisfied loyal customers carry more weight than traditional advertisements, leading to higher conversion rates among potential new customers. Higher Profit Margins Loyalty among your customers can greatly impact your business’s profit margins, as they tend to spend 67% more than new customers. This loyalty leads to several key advantages: Cost Efficiency: Retaining existing customers is five times cheaper than acquiring new ones, which cuts down on marketing costs and boosts profit margins. Increased Retention: A mere 5% increase in customer retention can elevate profits by 25% to 95%, underscoring the financial benefits of loyalty. Pricing Flexibility: Loyal customers are less sensitive to price changes, enabling you to implement higher pricing strategies without losing sales, further improving profit margins. Valuable Customer Insights How can valuable insights from your customers drive business success? By leveraging loyalty programs, you gain rich data on customer preferences and behaviors. This information helps you customize your offerings and marketing strategies effectively. For instance, analyzing loyalty member data can reveal which products boost customer engagement and satisfaction. Here’s a quick overview: Insight Type Benefit Example Customer Preferences Customized marketing strategies Personalized email campaigns Product Development Improved product offerings New flavors based on feedback Customer Feedback Enhanced customer experiences Service improvements Using this data, you can track shopping frequency and spending habits, leading to better-targeted promotions and increased revenue. Competitive Advantage in the Market In today’s competitive environment, businesses must leverage every advantage to stand out. Customer loyalty can provide a significant competitive edge, helping you secure and grow your market share. Here are three key benefits: Brand Stability: Strong loyalty programs differentiate your brand, making customers less likely to switch to competitors, which improves stability in a crowded market. Innovation Acceptance: Loyal customers are 50% more likely to try new products, allowing you to introduce innovations that will be well-received. Mitigated Price Competition: Loyal customers prioritize relationships over price, reducing sensitivity to price changes and easing competitive pressures. Frequently Asked Questions Why Is Customer Loyalty Important for a Business? Customer loyalty is important for a business since it markedly reduces costs associated with acquiring new customers. When you retain existing customers, you save money and increase profitability. Loyal customers tend to spend more over time and are likely to recommend your brand to others, enhancing your reputation. Furthermore, even a small increase in customer retention can lead to substantial profit growth, demonstrating how loyalty directly impacts your revenue and long-term success. What Are the Key Benefits of Customer Loyalty for a Business and How Do These Advantages Contribute to Its Long-Term Success and Profitability? Customer loyalty brings numerous advantages that greatly contribute to long-term success and profitability. For instance, loyal customers tend to spend more, often 67% more than newcomers, enhancing revenue. Furthermore, retaining existing customers is usually five times cheaper than acquiring new ones, which improves cost efficiency. In addition, satisfied customers are likely to recommend your brand, increasing brand awareness through word-of-mouth. As a result, nurturing loyalty can lead to substantial profit growth and sustainable business development. What Are the 4 C’s of Customer Loyalty? The 4 C’s of customer loyalty are Commitment, Consistency, Communication, and Community. Commitment reflects the emotional connection between you and the brand, driving repeat purchases. Consistency guarantees you receive reliable experiences, nurturing trust. Effective Communication makes you feel valued, improving your satisfaction. Finally, Community builds a network of loyal customers who engage with each other, amplifying word-of-mouth recommendations. Together, these elements create strong relationships that improve customer loyalty and overall brand success. What Are the 3 R’s of Customer Loyalty? The 3 R’s of customer loyalty are Retention, Referral, and Revenue. Retention focuses on keeping existing customers, as it’s markedly cheaper than acquiring new ones. A small increase in retention can lead to substantial profit gains. Referral emphasizes that satisfied customers are likely to recommend your brand, enhancing word-of-mouth marketing. Finally, Revenue highlights that loyal customers typically spend more, which boosts your overall profitability and contributes to a higher Customer Lifetime Value. Conclusion In summary, nurturing customer loyalty is crucial for your business’s growth and sustainability. By focusing on increasing retention, enhancing customer lifetime value, and encouraging word-of-mouth marketing, you position your brand for long-term success. Loyal customers not just contribute to higher profit margins but likewise provide valuable insights and create a competitive advantage in the market. Prioritizing these aspects can greatly improve your overall business performance and help you build a strong, reputable brand in your industry. Image via Google Gemini and ArtSmart This article, "7 Key Benefits of Customer Loyalty for Your Business" was first published on Small Business Trends View the full article
-
We may earn a commission from links on this page. Deal pricing and availability subject to change after time of publication. Samsung’s 27-inch Odyssey G5 (G51F) gaming monitor has dropped to $159.99 on Amazon, which is the lowest price it has reached so far, according to price trackers. That’s a noticeable discount from its usual $249.99 price, and it makes a lot more sense now for anyone ready to move on from a basic 1080p setup without jumping into the much higher cost of OLED displays. It’s a flat panel (unlike Samsung’s many curved gaming displays), with a matte coating that helps minimize glare in brighter rooms, and comes with a stand that supports height, tilt, and pivot adjustments (something many budget gaming monitors skip entirely). Samsung 27" Odyssey G5 (G51F) Gaming Monitor $159.99 at Amazon $249.99 Save $90.00 Get Deal Get Deal $159.99 at Amazon $249.99 Save $90.00 The G51F’s combination of 180Hz refresh rate, 1ms response time, and AMD FreeSync support makes fast-paced games look smoother and feel more responsive than they do on standard 60Hz displays, especially in shooters, racing games, and competitive multiplayer titles. The VA panel also helps the monitor deliver deeper blacks and stronger contrast than many IPS alternatives in this price range, so darker games and movies tend to look less gray and washed out. That said, while HDR10 support is included, buyers should keep expectations realistic—with 300 nits of brightness, this is more of a basic HDR experience than the kind of dramatic HDR you get from higher-end Mini LED or OLED displays. Outside of gaming, the Odyssey G5 works reasonably well as a general-purpose monitor too. The sharper 1440p resolution makes multitasking easier, and the extra screen space helps when editing photos, managing spreadsheets, or keeping multiple windows open. Connectivity is decent as well, with HDMI, DisplayPort, and USB support for accessories and peripherals. That said, like many VA panels, it can show some motion smearing in darker scenes, and people who mainly play competitive esports games may still prefer faster IPS or OLED options. Still, for under $160, this makes for a practical upgrade for someone who wants sharper visuals, smoother gameplay, and a more versatile display without overspending. Our Best Editor-Vetted Tech Deals Right Now Apple AirPods Pro 3 Noise Cancelling Heart Rate Wireless Earbuds — $229.00 (List Price $249.00) Apple Watch Series 11 [GPS 46mm] Smartwatch with Jet Black Aluminum Case with Black Sport Band - M/L. Sleep Score, Fitness Tracker, Health Monitoring, Always-On Display, Water Resistant — $329.00 (List Price $429.00) Apple iPad 11" A16 128GB Wi-Fi Tablet (Silver, 2025) — $319.99 (List Price $349.00) Shark AV2501AE AI XL Hepa- Safe Self-Emptying Base Robot Vacuum — $299.99 (List Price $649.99) Dell 15 DC15250 (Intel Core i7 13th Gen, 512GB SSD, 8GB RAM, Touch Display) — $599.99 (List Price $839.99) Deals are selected by our commerce team View the full article
-
The World Cup final will feature a star-studded halftime show headlined by Madonna, Shakira and boy-band BTS. FIFA has announced that, for the first time, the final at the MetLife Stadium in New Jersey on July 19 will include a Super Bowl-style concert. The governing body said the show would support the FIFA Global Citizen Education Fund, which is raising $100 million to help children access education and soccer. FIFA president Gianni Infantino said it would bring together “music and football on the biggest stage in sport for a very special cause.” “Every child should have the opportunity to dream, and together we can help make that possible,” he posted on Instagram. The show will be curated by Coldplay’s Chris Martin. The Super Bowl is famed for its halftime show — attracting the world’s biggest stars for spectacular performances. This year featured Puerto Rican artist Bad Bunny. Previous headliners included Michael Jackson, Paul McCartney, the Rolling Stones, Madonna, Prince, Bruce Springsteen and Rhianna. But halftime shows are not so commonplace in soccer, with events such as the Champions League final featuring a pre-match concert. This year will see the Killers headline European club soccer’s biggest game between Paris Saint-Germain and Arsenal in Budapest. FIFA describes its halftime show as “a singular moment at the intersection of sport, culture and purpose, broadcast live around the world.” This year’s World Cup is co-hosted by the United States, Canada and Mexico and runs through June and July. AP soccer: https://apnews.com/hub/soccer View the full article

-
On Wednesday, Cisco Systems announced impressive quarterly earnings alongside nearly 4,000 job cuts. The dichotomy stemmed from the hardware and networking company’s embrace of a rapidly growing trend in tech: openly admitting that layoffs are due to AI adoption rather than poor performance. “The companies that will win in the AI era will be those with focus, urgency, and the discipline to continuously shift investment toward the areas where demand and long-term value creation are strongest,” Cisco CEO Chuck Robbins told employees in a publicly shared email. “I’m confident Cisco will be one of those winners. This means making hard decisions—about where we invest, how we’re organized, and how our cost structure reflects the opportunity in front of us.” With his announcement, Robbins follows in the footsteps of tech leaders including Block CEO Jack Dorsey and Snap CEO Evan Spiegel, who made similar moves this year. Robbins emphasized that the company will further invest in employees’ AI use throughout their jobs. Meanwhile, employees will start getting notifications if they’ve been laid off on Thursday. Cisco says the job cuts make up less than 5% of its total workforce. Shares of Cisco Systems Inc. (Nasdaq: CSCO) were up more than 16% on Thursday morning. The stock had already been trading at record highs this month. How did Cisco perform during its third quarter? Cisco reported $15.8 billion in revenue for the quarter ending on April 25. That figure represents a 12% jump year-over-year (YOY) and beats Wall Street’s predicted $15.56 billion, according to consensus estimates cited by CNBC. The company also surpassed expectations of $1.04 earnings per share with $1.06 adjusted. In a post-earnings call, Robbins highlighted AI-centric business with companies like Nexus and Nvidia, as well as a significant increase in revenue from AI. For instance, this quarter, Cisco shared plans to expand its secure AI factory with Nvidia. Cisco’s product revenue rose 17%, something Robbins attributes to “robust demand for our AI infrastructure and campus networking solutions.” Cisco expects its revenue to reach $16.7 billion to $16.9 billion in quarter four and $62.8 billion to $63 billion for fiscal year 2026. In comparison, it saw $56.7 billion in revenue for fiscal year 2025. View the full article

-
We may earn a commission from links on this page. Deal pricing and availability subject to change after time of publication. OLED gaming monitors have become much easier to recommend over the last year, mostly because prices have started dropping below the $500 mark. LG’s 27GX704A-B UltraGear OLED is one of the better options in that category right now, with excellent motion handling, extremely low input lag, and the glossy WOLED panel that gives games a cleaner, more contrast-heavy look than many matte alternatives. It’s also down to $477.99 on Amazon, a 40% discount from its usual $799.99 price. LG 27GX704A-B Ultragear OLED Gaming Monitor $477.99 at Amazon $799.99 Save $322.00 Get Deal Get Deal $477.99 at Amazon $799.99 Save $322.00 At this price, the LG 27GX704A-B lands much closer to premium IPS gaming monitors while still offering the contrast and motion performance OLED panels are known for. This is a 1440p display with a 240Hz refresh rate, so it’s clearly aimed at PC gamers who care more about responsiveness and motion clarity than pushing full 4K resolution. Competitive games like Valorant, Apex Legends, and Call of Duty benefit the most here because the near-instant response time keeps motion looking unusually sharp, even during fast camera movement or flicks across the screen. The panel itself uses LG’s newer third-generation WOLED technology and supports both FreeSync Premium Pro and G-SYNC compatibility, so screen tearing is less of an issue regardless of whether you use an AMD or NVIDIA graphics card. One of the more noticeable differences between this model and LG’s earlier UltraGear OLED displays is the glossy screen coating—instead of the matte finish found on many gaming monitors, this panel looks clearer and a bit punchier in darker rooms because the coating doesn’t soften the image as much. Blacks look genuinely deep, HDR highlights stand out nicely, and games with darker environments benefit a lot from the OLED panel’s per-pixel lighting. The downside is that reflections become much more noticeable if your setup sits near a sunny window or a bright overhead light, and VRR flicker can appear when frame rates bounce around heavily in darker scenes. The LG 27GX704A-B is also positioned as an entry-level OLED gaming monitor, so you won’t get premium features like DisplayPort 2.1, a built-in KVM switch, or an especially advanced USB hub beyond two basic USB-A ports. Our Best Editor-Vetted Tech Deals Right Now Apple AirPods Pro 3 Noise Cancelling Heart Rate Wireless Earbuds — $229.00 (List Price $249.00) Apple Watch Series 11 [GPS 46mm] Smartwatch with Jet Black Aluminum Case with Black Sport Band - M/L. Sleep Score, Fitness Tracker, Health Monitoring, Always-On Display, Water Resistant — $329.00 (List Price $429.00) Apple iPad 11" A16 128GB Wi-Fi Tablet (Silver, 2025) — $319.99 (List Price $349.00) Shark AV2501AE AI XL Hepa- Safe Self-Emptying Base Robot Vacuum — $299.99 (List Price $649.99) Dell 15 DC15250 (Intel Core i7 13th Gen, 512GB SSD, 8GB RAM, Touch Display) — $599.99 (List Price $839.99) Deals are selected by our commerce team View the full article
-
Today is an important day in the 2026 IPO landscape: Cerebras Systems Inc. is making its much-anticipated market debut. While not a household name like Nvidia, Intel, or TSMC, Cerebras is a chipmaker that is rapidly becoming a critical player in the AI semiconductor space. And investors will be casting a keen eye on how its stock performs in the early days of trading, looking for hints about how other, even more anticipated AI-related listings may play out later this year. Here’s what you need to know about Cerebras and its initial public offering: What is Cerebras Systems? Cerebras Systems is an AI semiconductor company headquartered in Sunnyvale, California. It was founded in 2015 by Andrew Feldman, Gary Lauterbach, Michael James, Sean Lie, and Jean-Philippe Fricker. Feldman is the company’s CEO. The company specializes in making the largest—quite literally—computer chips in the world, chips that are optimized for running AI tasks. While most computer chips are made from large wafers that are then divided to make smaller, individual chips, a single Cerebras chip is the entire wafer. As Fast Company previously reported when it named Cerebras one of the most innovative AI companies of 2026, the large size of its chips means they can perform AI tasks much more quickly—up to 70 times faster than the GPUs that many AI systems run on today. “The large square chip packs a lot of processing power and memory on one piece of silicon, so almost no time is wasted routing data between separate chips,” Fast Company’s Mark Sullivan previously noted. “That makes it highly effective at processing data from commercial AI applications that require massive throughput and very fast response times.” Cerebras’s customers include pharmaceutical companies like AstraZeneca and GlaxoSmithKline, as well as tech firms like G42, IBM, Meta, Mistral, Notion, and Perplexity. Most recently, Cerebras inked a $20 billion deal with ChatGPT maker OpenAI. When is Cerebras Systems’ IPO? Cerebras Systems priced its shares on Wednesday. It is expected to list on Thursday, May 14, 2026. What is Cerebras Systems’ stock ticker? Cerebras Systems’ shares will trade under the stock ticker “CBRS.” The stock will trade on the Nasdaq Global Select Market. What is the IPO share price of CBRS? The initial public offering price for CBRS shares is $185 per share. This final IPO price is remarkably higher than the IPO share price Cerebras said it would pursue just a few weeks earlier. On May 4, the company announced it would initiate the road show for its upcoming IPO. At that time, Cerebras said that the initial public offering price was expected to be between $115 to $125 per share. While it is not uncommon for a company to tweak its IPO price in the days leading up to the actual IPO, the final $185 IPO share price is around 60% higher than the low end of the original range. This suggests that demand for shares was much greater than initially anticipated. How many CBRS shares are available in its IPO? Upon its IPO listing, Cerebras Systems made 30 million shares of its Class A common stock available. The company’s underwriters, which include Morgan Stanley, Citigroup, Barclays, and UBS Investment Bank, also have a 30-day option to buy an additional 4.5 million shares. How much did Cerebras Systems raise in its IPO? Selling 30 million shares at $185 each means Cerebras raised $5.5 billion in its IPO. As noted by CNBC, that makes this offering one of the largest U.S. tech IPOs in recent memory. It puts Cerebras above the $3.8 billion that Snowflake raised in its 2020 IPO, and behind the roughly $8 billion Uber raised in its 2019 IPO. How much is Cerebras Systems worth? At its IPO price, Cerebras is now valued at around $56.4 billion, according to CNBC. 2026 is shaping up to be the year of AI IPOs Given all the hype and hope around AI, it’s little surprise Cerebras’s IPO shares went for significantly higher than the company had originally forecast. And the successful IPO also bodes well for other AI companies that are likely to go public this year. Two of the most anticipated AI-related IPOs of 2026 include Claude maker Anthropic and ChatGPT maker OpenAI. Current rumblings point to Anthropic debuting first, followed by OpenAI by the end of the year. Of course, AI companies aren’t the only tech firms expected to go public in 2026. Another big tech company that will likely IPO this year, perhaps as soon as this summer, is Elon Musk’s SpaceX. Taken all together, 2026 could be one of the biggest years on record when it comes to the total valuation of all tech IPOs scheduled to go public. View the full article

-
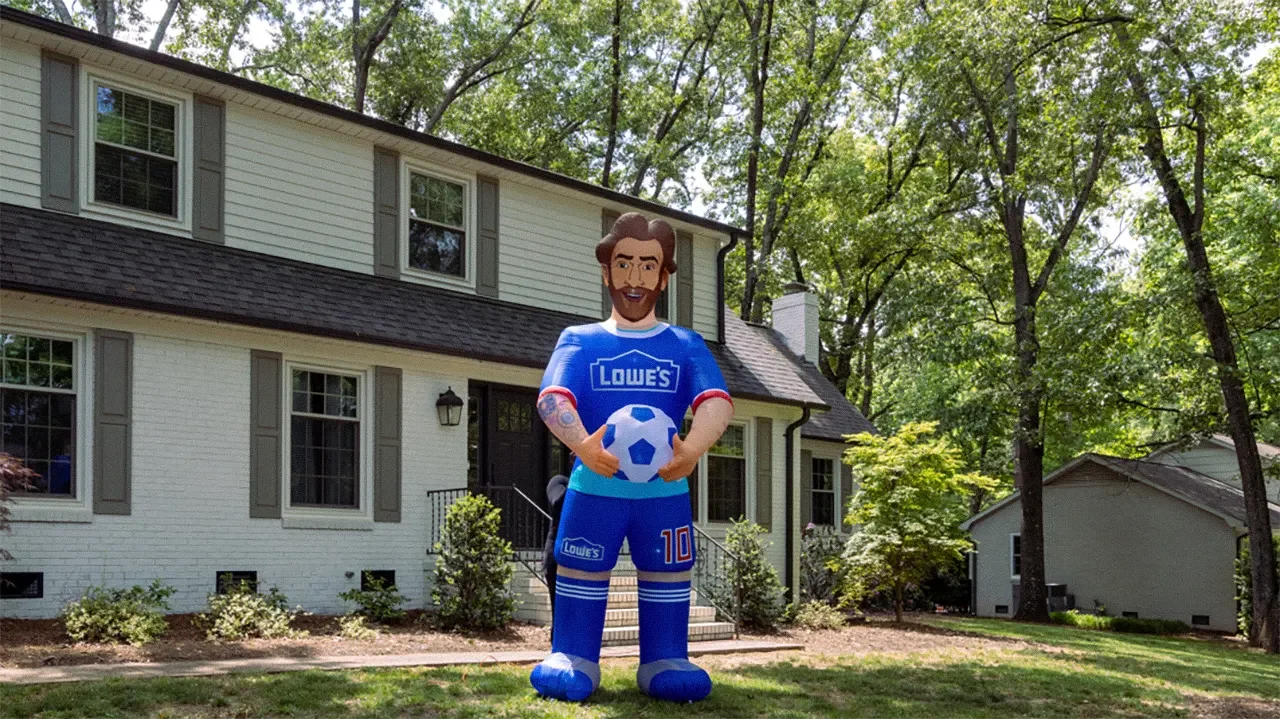
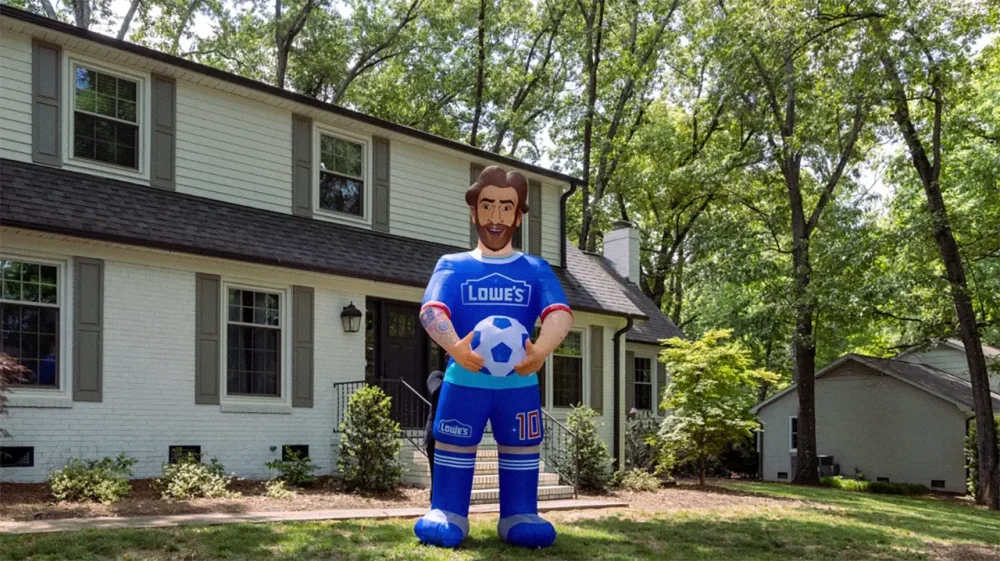
Dozens of brands are using the 2026 FIFA World Cup as a chance to cash in on themed ads, products, and brand collaborations. But the home goods giant Lowe’s is doing something unique: debuting a 10-foot-tall inflatable of Lionel Messi for fans to put in their front yards. Lowe’s is running a series of activations for the world’s biggest soccer moment, all of which center on its limited-edition, $99 Messi inflatable, made in collaboration with Messi himself. The inflatable, which will start to pop up in a 20-foot version around several U.S. host cities in mid-May, will be available online to Lowe’s rewards members starting on May 18, followed by a limited release in select stores on May 20. According to Jen Wilson, Lowe’s chief marketing officer, the company is planning to release only about 5,200 inflatable Messis—and it expects them all to sell out. The reason for Wilson’s confidence is twofold: First, she says, while plenty of brands will be planning their own activations for the World Cup, not many others could even attempt a product in this niche. And, second, the move is backed up by company data that yard decor—especially personalized decor—is becoming more popular among consumers, even outside of the typical holiday windows. It’s a trend that, oddly enough, might just trace all the way back to a giant skeleton that stole the internet’s heart in 2020. What in the world is going on with yard decor? Over the past few years, I’ve been noticing a trend in my Chicago neighborhood. Outside the typical festive months of October through January, I’m seeing more and more holiday decorations left out in people’s yards and stylized for each new season. Oftentimes, that takes the form of a giant skeleton dressed up in a personalized outfit or performing some kind of goofy stunt. There’s a very real subculture to back this up, and it all stems from a giant Home Depot decoration. In 2020, Home Depot released a 12-foot-tall skeleton decoration that almost instantly went viral, earning the internet moniker “Skelly.” In the years since then, Skelly has become the only Halloween product that Home Depot brings back year after year, consistently selling out to its legion of fans. Skelly has amassed a cult-like following, and, in turn, inspired a small but committed group of decorators to keep their skeleton decor up year-round, giving them customized outfits and accessories for events like back to school and arranging them in silly poses like a staged flag football game. Skelly’s popularity seems to point to a broader shift in how Americans view their yard space. Wilson says that Lowe’s also saw consumers’ interest in out-of-the-box yard decor spike starting back in 2020—and the trend has only grown since then. “For us it was really this explosion of both all things mini and all things giant,” Wilson says. She believes Lowe’s was one of the first companies experimenting with products like mini buckets or mini toolboxes, which have become huge fan favorites. On the other end of the spectrum, like Home Depot, Lowe’s has begun investing in new giant animatronics, including its popular 10-foot Abominable Snowman, 8-foot Skelly-esque skeleton, and 12-foot-tall Immortal Nightwalker. Outside of the holidays, the brand has noticed and capitalized on year-round yard trends, like the “porch goose,” a TikTok-viral concept wherein customers buy a concrete goose and dress it up seasonally—just like some Home Depot fans with their beloved Skellies. “We do absolutely see a rising trend in outdoor decor and consumers either keeping outdoor decor up longer or participating in trends like the porch goose,” Wilson says. “It’s all really interconnected to expressing your own sense of style and culture and just being a part of something.” She attributes the rising consumer interest in these novelty products to something she describes as “similar to the lipstick effect,” or the idea that consumers will increase spending on small luxuries during moments of economic strain. “People still want indulgences, even if there’s a pressured economy,” Wilson says. “A larger-than-life item in their front yard is something that just makes them feel joyous, and that’s what people are looking for.” With the Messi inflatable, Lowe’s is betting that the same theory will apply to World Cup fans who are watching the games from their homes, but want a way to let their whole neighborhood know that they’re part of a larger moment. The Skelly of soccer Given Lowe’s “affordable indulgences” decor theory, one of the in-house design team’s key considerations when building the inflatable Messi was cost. “We wanted it to be under $100, particularly as people are paying attention to their wallets and obviously the rising costs of gas,” Wilson says. “When we know that the consumer is super focused on essentials, if they’re going to make this splurge, we want to make sure that it’s affordable. We typically look at engineering most of our gigantic items somewhere in the under-$300 range.” That price constraint helped Wilson’s team to determine the actual height of the inflatable, opting for 10 feet rather than 15 or 20 in order to conserve materials and lower costs. Then, to get every detail just right, the team went directly to Messi to determine how the inflatable should look: each aspect, from the length of his hair to his beard, tattoos, and the look of his arms and legs, was given Messi’s final approval. “We just wanted it to feel authentic and for him to be proud if he was driving down a neighborhood in Miami and saw himself outside of a home,” Wilson says. “He loved where we landed, and we’re thrilled.” View the full article
-
“Who are your enemies?” I was asked this interview question throughout my entire career. And I’d always come up blank. Every time. No enemies. And when I failed to produce an impressive enemy list, the reaction was always the same: How can you claim to be competent if you haven’t made powerful enemies? I came to understand this enemy thing was rooted in the male idea of power. That men tend to see winning and power like this: For me to win, you need to lose. I came to realize that this advice to be powerful enough to have enemies was basically an invitation to turn into an aggressive bully to advance my career. But here’s the catch. I was bullied as a kid. And it was awful. So, early on, I decided that I was never going to choose to be like the bullies who hurt me. And if that was not good for my career, so be it. I would find another way. I often wondered if I was limiting my career by being too nice. And worried if I was supposed to feel powerful? Am I supposed to act powerful even if I don’t feel powerful? Am I doing the job of a leader wrong because I don’t feel powerful? Even when I was in my biggest roles, where I had actual power at my fingertips — thousands of employees under my watch, millions of dollars of budget to manage, billions of dollars of revenue to keep growing — I never felt personally powerful. Mostly, I personally felt crushing responsibility. I felt insecure about the power thing for years. The VP Bully Then one day, what I needed to do about this idea of acting powerful like the men became very clear to me. I was at a client’s office on Long Island. Sitting in a small conference room were the VP of technology, who was a large, dominant type, and one of his direct reports, whom I’ll call Seth. The VP told me, “The reason we are having this problem is that Seth makes stupid mistakes. He’s not good at his job. No one listens to Seth. He screws everything up.” Seth looked small and mortified. I was cringing and heartbroken for him. I knew what it felt like to be bullied like this. “Little Patty,” who had been bullied herself, could feel her childhood insecurities and fears bubble up watching this VP berate Seth. I had worked with Seth on prior occasions. Seth knew a hundred times more than this VP. The problem was not Seth. This VP was a bully. But then a really weird, creepy thing happened a bit later, when the VP walked me out, and we ran into his boss in the lobby: this bully instantly became a cowering suck up to his boss. I was appalled. He needed to abuse Seth to feel powerful, but he was afraid to be powerful with his boss. Watching this scenario, a new thought started to brew: Wait a minute, if I am still the same insecure little kid on the inside, probably so is this jerk. And once I saw it, I couldn’t unsee it. Forever after leaving that lobby, whenever I see a big, scary man acting like a powerful bully, I see the hurt little boy, as plain as day. I want to reach over, gently squeeze his forearm, and say, “Aw, did somebody steal your ball? Did your father yell at you for crying about it? Poor thing.” A better way Seeing the big bullies as fragile little boys was my first step toward understanding that there was a better way to show up as a leader than “powerful.” And with this insight, when I got bullied at work, I could mostly just step aside and let the aggression roll by instead of being crushed by it. My mom had given me the key to keeping my self-esteem intact with bullies all those years ago. And I have used her advice for the entirety of my career and life: Bullies need to make you feel worse than they feel on the inside. It’s always about them. It’s never about you. Once I saw these men as their own little version of Kevin or Harold, struggling with their own insecurities, I was no longer worried that they were innately gifted with a kind of power that I didn’t have access to. It made me stop worrying once and for all about feeling or even acting powerful. It just didn’t matter. I chose to be a leader who was first and foremost kind and respectful to people. People are not productive when they are self-protecting. I focused on making people feel safe. My teams executed on our commitments. We grew the business. My organizations got more capable over time because I invested in and cared about the people. For me, real power is not personally owned. The aggressive, bullying version of personal power is just insecurity masquerading as strength. Sharing power with others so you can get big, amazing things done together is true power. That was the sort of power I chose to cultivate and the kind of leader I chose to be. Do aggressive bullies get ahead? Yes, of course they do. But I learned it’s not the only option. You can make a different choice. I made a different choice. I chose not to model the idea of power that was being shown to me by the men. You might say I chose to stay “too nice”. And you know what? It did not limit my career. If anything, it accelerated it. I was able to build a highly capable team of people who were productive and motivated because I chose to make them feel powerful. And the idea of being or acting powerful personally didn’t confuse me anymore. I had no interest in the win-lose version of power. I just let the men duke it out among themselves, and I created my own path forward that was true to my belief that kindness and strength can go hand in hand. Because making people feel respected and safe makes them wildly productive. And on the enemies thing, I just think, if I can win and you can win, why is that not better? View the full article

-
The critical challenge is to build institutions that protect us from tech companies and the stateView the full article
-
Custom AI models are not just for the AI giants anymore. Because the 37-person startup Krea is releasing its first generative AI model as the design tools startup repositions itself as a full-fledged AI research lab. The move is significant for Krea, but it also seems to tease an almost inevitable moment in the rapidly evolving AI market, where smaller players in the industry can make more disruptive bets. On one hand, Krea can hardly call itself a bootstrapped startup anymore. It’s now raised $83 million through its Series B at a $500 million valuation. On the other, it’s tiny compared to the leading frontier model companies, which constantly raise more money to ensure they have an unlimited war chest to train the next best model: OpenAI and Anthropic, which have raised $180 billion and $72 billion, respectively. But to Krea’s co-founder, Diego Rodriguez, it’s invigorating to be small, nimble, and, by one significant measure, no less successful than any frontier model company as a core business. “Until there’s a winner—until OpenAI or someone is profitable—the Olympic Games are on,” he says with a mischievous smile. The evolution of Krea Krea launched in 2023 to be something like the Adobe of the AI age, a creative platform designed from scratch to allow you to not just generate media with AI, but to tune those outputs, with controls that feel more like a synthesizer than a drafting table. They were the first to offer real-time AI editing tools and the first to put APIs from other AI models into their own app (a practice that has now become standard). And they were quickly profitable. But over time, the team has recognized a distinct ceiling to their work: Krea can only be as open-ended as the models it sits upon. Image models of today are amazing at specific prompts that often go viral, but they can also feel like they are built on rails. Creative phrasings can still lead you down the same old paths, as models fail to reproduce what’s in your mind’s eye. “The models are trained not to fail and to always give you a good image,” says Krea’s co-founder, Victor Perez. “And I feel like that takes away a lot of the creative uses—breaking the barriers and letting people go off-road, letting [you] make ‘bad’ images, stuff that looks more artistic that a creative might appreciate more.” Indeed, image models are amazing when it comes to what these companies have been prioritizing: photorealism. But any designer reading this knows that when it comes to graphic design and illustration, you can hit the boundaries faster than you’d think. In a demo, Krea pulls up comparisons of the prompt “a cat riding a bicycle” between itself and Google’s Nano Banana. In Krea’s case, the first outputs are funky and varied, with some exhibiting a hand-drawn feel. In Google’s, no matter how you adjust the prompt, you get a similar coloring-book-looking image presented in the same way. It’s the difference between eating at McDonald’s or a Michelin burger joint. One will always aim to please, while the other may polarize. “I think that the kind of stuff that we are interested in is more niche,” says Perez. “It’s a much smaller market, but we’re fine with it.” Spending 15 minutes prompting Krea’s new image model K2 on my own, and I’m impressed by its breadth. It generates surreal photorealistic scenes, but also grainy VHS-style filtered images and a variety of illustrative techniques (word marks, manga, anime, hand sketching, and sharpie cartoons) well. The examples I saw from Krea were also impressive—and wildly so given the gulf in resources between Krea and the giants. Perez attributes this success to his team’s own taste. They’ve spent the last seven months building their own data set (no, they aren’t disclosing the sources), labeling it by hand, and creating their own unique workflows to train their own generative AI system. As Perez explains, most big models start the same in development to build a functional neural net, but mid- and post-training steps in particular are what give the model a point of view. I’ve heard from people in the industry that there are only about 200 true post-training experts in the world, which is why the market is so competitive. “That’s when the artistic direction on the model takes place,” says Perez. “At the end of the day, building a model is almost like crafting a sculpture.” That final layer of training, where a model develops its visual or verbal voice, is where taste comes in. Making the AI do one thing better can often make it do another thing worse, and balancing those priorities is particularly tricky when trying to build a model that makes cool, personally expressive stuff. “This is like the nemesis of an AI researcher, because what researchers are really good at optimizing for [is] metrics,” says Perez. “But what is this metric that we are optimizing for? Like, it’s something so subjective.” The user interface K2, Krea’s new model, seems impressive on its own. But what makes it so attractive is how Krea will let you use it. On the baseline, Krea promises that just describing what you want will get you better results with K2 than its competitors. Then Krea’s user interface lets you really get your hands dirty in tuning the output. You can drag one or multiple images you want into the prompt bar, to use that to influence the style it generates. Then you can drag a slider up or down on those images, to signal how much you want them to influence the visual style. You can even build a mood board to inform the aesthetic that you’re after. (After generating some images, Krea will proactively produce a sort of personalized Pinterest board with more images it thinks you’ll like.) Because this system is built for creatives, Krea is also being careful with how it frames up IP. As you ostensibly train your own model inside Krea, you can remove that from Krea’s own model training. And all IP generated is your own. So if you are an oil painter who has a very particular style that you want to use within gen AI media, you can upload your work to reproduce it without worrying that Krea is about to sell that as a filter to someone else. Longer term, Krea is considering if there are ways to credit artists whose IP measurably influences a piece of media, and they’re experimenting with using AI to do just that to create a more sustainable royalties system. Rodriguez admits some confusion as to why, in an industry dominated by OpenAI, Anthropic, and Google, smaller AI companies aren’t banding together in order to build bigger ideas and share the wealth. Originally, Krea tried partnering with a model company that refused to offer even a small split of revenue, which led them to develop the technology completely in-house. But now, I can’t help but notice how much Krea’s ambitions have grown. Perez declares that this launch product, K2, is “conservative.” The GPU cluster Krea is using for a year, over which time it will have trained K2 and two future Krea models, will cost the company $20 million. Krea couldn’t afford to faceplant with an experimental approach that might not work. However, with a success under their belts, they feel more confident to take more risks and challenge training norms. “We just wanted to make it work,” says Perez. “It worked way better than we expected, but this was an extremely risky bet. We’d never trained a model before. We didn’t know how hard it would be. And it was it was fucking hard, but at the end of the day we figured it out. And now we know so many things—because there’s so many things about training a model that you can only learn through training a model.” View the full article

-
If you were to travel back in time to 1996 with a 2TB thumb drive, you’d be able to fit the entire World Wide Web on it. Of course, that kind of storage didn’t exist in the ’90s, so it’s never been that simple for the Internet Archive. The nonprofit site, which launched three decades ago this year, went from making copies of the web on tape drives to storing more than 1 trillion pages worth of Internet history at data centers around the world. Using its Wayback Machine, anyone can look back to what a web page used to look like, which means you can browse through old GeoCities websites, view Google’s original Code of Conduct (back when it still said “Don’t Be Evil”), or read the EPA’s climate change indicators before the The President administration scrubbed them. All that’s on top of the Archive’s vast collection of other digital resources, from live concert tapings and public domain e-books to troves of forgotten DOS games. Roughly 2 million people access the site’s resources every day. “We want it all,” says Brewster Kahle, the Internet Archive’s founder and chairman. “We want all the public works of human beings. So if we don’t have it, we want it.” But while the Internet Archive hasn’t fundamentally changed over the years, the Internet itself is transforming in ways that jeopardize the nonprofit’s mission. Web publishers have started blocking the Wayback Machine out of fear that AI companies are scraping the material. A legal battle with book publishers ended with the Archive paying a settlement and removing more than 500,000 books from its collection. Meanwhile, the cost of storing humanity’s digital footprint keeps going up, as demand from AI data centers drives up storage and memory prices. All of which makes Kahle wistful for how things used to be for the Internet Archive, before book publishers, tech giants, and the legal system got in the way. “We have to still try to make a library work, even though it’s a difficult, difficult time for libraries,” he says. The Internet Archive isn’t just a way to access old web pages, important as that may be. It’s also a repository for information and culture that anyone can access, download, and do what they please with. In a world where digital content is increasingly licensed rather than owned, that in itself seems like something worth preserving. How it started Kahle had been dreaming of something like the Internet Archive long before it became feasible. In the early 1980s, he studied AI at MIT and became a lead engineer on supercomputers at Thinking Machines. The modern internet wasn’t born yet, but he recalls imagining that these supercomputers would someday make reference materials readily available to anyone. “For me, back in 1980, the idea was to try to build this thing that we’d long since promised by then, which was the Library of Congress on your desk,” he says. The real epiphany, though, came in 1995 while Kahle was visiting the offices of AltaVista, one of the first Internet search engines. While early work on the internet had focused on decentralized protocols, AltaVista had built something useful by providing a hub of all the Internet’s knowledge. Kahle realized the same crawling technology could help make full copies of web pages for archival purposes, which AltaVista wasn’t interested in doing. “I thought that the key was making sure that the works of humankind would be preserved, so we went off to collect it,” he says. Kahle kicked in some of his own money to start the Internet Archive—he’d sold an early web publishing system called WAIS to AOL for shares worth $15 million, after spinning it off from his work at Thinking Machines—and got some help from outside backers. But the real heavy lifting came from Alexa Internet, the for-profit traffic analysis company that he founded at the same time as the Internet Archive. For every web page that Alexa crawled, it donated a copy to the Internet Archive, and Kahle made sure that arrangement endured even after Amazon acquired Alexa for $250 million in 1999. Amazon quietly contributed to the Wayback Machine for more than 20 years, until it shut down Alexa Internet in 2021. (The Alexa name, which was based on the Library of Alexandria, lives on as the name of Amazon’s virtual assistant.) “My hat is off to Amazon,” Kahle says. “They could have figured out how to get out of that contract, but they didn’t. So it really gave the Internet Archive, when it was a very young nonprofit, a content set.” Running the Archive The Wayback Machine was rudimentary at first, relying on simple automations to capture the code behind each webpage, preserving what they said and looked like at that moment. Over time, it’s become increasingly sophisticated, with new crawling engines aimed at capturing the growing complexities of the modern web. These days, the Wayback Machine takes snapshots of roughly 1 billion URLs per day. It maintains copies of more than 1 trillion web pages, and stores 100 terabytes of new data per day in the process. Still, Kahle says the Wayback Machine represents only about 60% of the Internet Archive’s data. The rest comes from its vast digital collections, including radio shows, podcasts, defunct mobile apps, DOS games, CD-ROM software, publicly available scientific research, scans of vintage magazines, classic TV shows, past cable news broadcasts, documents scanned from microfiche, and more. Both sides of the Internet Archive share the same computing resources. Despite the scale at which it operates, running the Archive is a surprisingly human endeavor. While the site has tens of thousands of automated processes for archiving the web, its resources are ultimately limited, and it often needs to set priorities, says Mark Graham, the Wayback Machine’s director. “Part of what I do every day is pay attention to this process, through conversations, through examining what we’re archiving and maybe what we’re not archiving,” Graham says. Graham recalls a recent example in which the State Department revealed plans to delete its posts on X from before Donald The President returned to office. He quickly spun up a project with his team and ultimately saved more than 2 million posts, hundreds of thousands of which have since vanished from their original URLs. Graham’s team has also made emergency copies of online publications whose shutdown is imminent, as he did recently with a prominent gaming site (which he declined to identify). “We’re notified almost every day about certain web properties that are going to be shut down,” Graham says. “Often we’ll get weeks or months of advance notice, but sometimes we don’t.” The Internet Archive doesn’t undertake all the work on its own. The group partners with more than 1,400 other groups, including libraries, universities, and museums that help decide what’s worth saving at any given time, and it operates a paid service called Archive-It for groups that want to maintain their own digital collections. Individual users can also archive pages manually through a web form or browser extension, and can even upload files for the Internet Archive’s digital collections. “It’s a healthy mixture of different methodologies, different motivations, different agency,” Graham says. Threats to the archive For most of its existence, the Internet Archive hummed along without much conflict. That’s started to change over the past few years. For the Wayback Machine, the web itself has become harder to archive. The Internet Archive doesn’t save paywalled articles, so it’s missing large swaths of content from major publishers. “It’s gotten a lot harder to do a good job of archiving the public web, because more and more of the web is not public,” Graham says. Some of those publishers have also started blocking the Internet Archive to prevent AI companies from scraping their content. Nieman Lab reported in January that 241 news sites explicitly block at least one of the Internet Archive’s crawling bots, most owned by the newspaper conglomerate USA Today Co. The French newspaper Le Monde has blocked the site as well, while The Guardian has filtered its articles from the main Wayback Machine interface. Reddit also began blocking the Internet Archive last year. Graham says the Internet Archive employs a variety of tactics to turn away AI scrapers, but acknowledges that this requires “nearly constant care and feeding.” Jack Cushman, director of the Harvard Library Innovation Lab, says publishers may be largely indifferent to the work of archivists, at least compared with the more immediate threat of AI repurposing content or putting a strain on their servers. (Cushman’s lab has developed its own archiving tool, called Perma.cc, that it offers to individuals and institutions.) “The upshot is that the doors are slamming shut, incidentally keeping us out, when they don’t really care about us in the first place,” Cushman says. Meanwhile, AI is posing a threat in another way, in that demand from AI data centers is driving up the cost of storage. Kahle says the Internet Archive’s hard drive costs have already tripled to quadrupled as result. “We’re going to have to start becoming really clever about how to go and continue to archive,” he says. And as the cost of storage is going up, a growing proportion of what people consume online involves video on sites like YouTube and TikTok, taking up more space than static images and text. That means the Internet Archive must become even more selective about what it saves. Its YouTube collection is only in the millions of pages, versus more than a trillion web pages overall. “There’s other cases where there is just so much material on a given platform or service that we don’t have the capacity,” Graham says. Outside the realm of archiving the web, the Internet Archive’s digital collections have become a source of legal trouble. Book publishers sued the group in 2020, after it started lending out digital scans of physical books as a response to the COVID-19 pandemic. That resulted in an undisclosed settlement and the removal of 500,000 books from the Internet Archive’s collection. The group also settled a separate record label lawsuit over its collection of digitized 78 rpm records, though those remain available. Cushman says that those lawsuits have drawn attention to the well-intentioned risks that archivists take with copyrighted material. While the Internet Archive has typically avoided things that might upset copyright holders, that’s started to change in recent years. “They’ve moved into some things—especially with the pandemic—that really did anger some people with deep pockets, and great lawyers, and so on,” he says. “It makes the edifice a bit tippier in a way that I think that no one would have wanted.” Kahle and the Internet Archive see those lawsuits as a major detriment to its mission, one that further moves all content consumption to a model of licensing and surveillance, rather than ownership. “The United States has just kind of descended into just lawsuits, where in the ’90s, the United States was interested in innovation, and having a game with many winners,” Kahle says. The Internet Archive remains an indispensable resource, Cushman says, one that’s regarded among archivists as something of a benevolent monolith. There’s a playfulness in how it operates—for instance, in offering a playable collection of LCD gaming handhelds—that no one else is doing. But its challenges also make him wish there were more organizations trying to do similar things. “It’s different from anything else that we have,” Cushman says. “So I think we look at it with a mix of gratitude, where we’re fortunate that it happened, and then apprehension because there’s only one of it.” Looking ahead Kahle built his life’s work around digitizing the world’s knowledge and even using AI to make it more accessible. Now that future is finally materializing, but in a way that is, ironically, concentrated around a handful of well-funded tech companies, media conglomerates, and publishing giants. As a young engineer, that possibility was never on his radar. “I didn’t predict the monopolies,” he said. Kahle still sees AI as an opportunity to sort through the Internet Archive’s vast stores of data. Researchers are already using it, for instance, to do things like interpret key talking points on Russian newscasts, and the Internet Archive has been leaning on AI to help digitize and translate more content. But those opportunities, he says, are increasingly happening outside the United States, where there’s more legal certainty around what libraries can collect and digitize. The European Commission, for instance, is pursuing the concept of AI for the public good, promoting tools that tackle specific challenges like climate change and health care. The Internet Archive Europe, a separate group on which Kahle is a board member, has been backing a open-source tool called ClimateGPT that applies large language models to climate research. “There could be hundreds of innovative organizations going and conquering all sorts of niches, if they had the same kinds of policies in the United States that we had in the 1990s when we let search engines happen here,” Kahle says. Still, Kahle says he’s not discouraged, because fundamentally people want their works to be read and preserved. They also want good information that’s easily accessible, which is why the Internet Archive is being used now more than ever. And while the Internet Archive was born from the idea of centralizing the world’s knowledge, lately it’s been sponsoring conferences on ways to decentralize the web again. It’s early days, but he’s hopeful that this will lead to new business models that recapture what once seemed possible 30 years ago. “Let’s build systems that support communities,” Kahle says. “Let’s make tools for participation. Let’s build democracy’s library out of all the works that can and should be shared, so we’re all building on a common commons of information.” View the full article

-
Wendy’s is feeling blue. Light blue, to be exact. In April, a new design concept accompanied the opening of the burger chain’s 100th store in the Philippines. In addition to its digital-first layout, the new Wendy’s boasts a light blue facade instead of a red one. The refreshed restaurants are now available to franchisees across the company’s international markets. Wendy’s tells Fast Company that locations are also open in Chile, England, and Scotland, but there are currently none in the U.S. The blue color scheme is part of an initiative Wendy’s is calling “Future Fresh” that could make one of the brand’s secondary colors more primary if adopted widely. On the company’s May 8 earnings call, CFO Ken Cook, who is also currently serving as Wendy’s interim CEO, said the new store format makes the brand stand out from the competition—and he’s not wrong. Though the shades are different, Wendy’s shares a main brand color with plenty of other fast-food chains, like McDonald’s, Burger King, Jack in the Box, In N Out, and Chick-fil-A. There’s good reason so many fast-food companies are branded with ketchup-colored red: The color can make you hungry. For Wendy’s, though, cool blue isn’t such a leap. Its long-used cartoon mascot (inspired by founder Dave Thomas’s red-headed daughter) is accented in blue, and in the past the company has used the hue for its blue-and-white-striped worker uniforms. Wendy’s new digital-first layout is one that many chains are embracing, as in the rise of self-serve kiosks at McDonald’s or Chick-fil-A’s mobile-only store in New York City. Starbucks, on the other hand, has moved away from the grab-and-go concept with café renovations designed to entice customers to stick around. The coffee chain announced last year it’s closing its pickup-only locations in favor of a new store concept with cushier seating and laptop-friendly tables ideal for remote workers. Instead of investing in a cozier dining room or bringing back its salad bar, Wendy’s is catering to mobile orders and grab-and-go customers with its new store design. Wendy’s announced last year that it would close hundreds of U.S. restaurants, and there’s an effort to try and take the company private. Internationally, though, the Ohio-based chain is still expanding, meaning more locations overseas could open with the blue building. Cook said last week the company signed new franchise agreements to build up to 1,000 restaurants in China over the next decade. Wendy’s last rebranded in 2012, removing long-running brand identifiers like the color yellow, vintage-style typography, and its “Old Fashioned Hamburgers” tagline. The modernized logo and sterile restaurant designs fit trends at the time, but also lost the nostalgic feel of a fast-food chain where you could once enjoy Frosties and chili served in bright yellow cups while sitting in a sunroom. Architecturally, the sanitized, modern “Future Fresh” building doesn’t unbland what Wendy’s has blanded—but at least light blue isn’t greige. Wendy’s didn’t respond to a question about how widely the blue color scheme might be adopted, but by making the color more prominent, Wendy’s would at least ensure its restaurants are never confused for those of its competitors. View the full article
-
For most of the last century, we believed human potential could be measured through intelligence, and we built whole institutions around that belief. IQ was the metric. If you were analytical enough, technically proficient enough, quick enough on your feet, doors opened, schools rewarded it, employers screened for it, and entire industries grew up around identifying and elevating it. Then we noticed what intelligence alone couldn’t do. Technical brilliance without humanity tended to create distance rather than trust, and a generation of leaders who were brilliant on paper proved unable to inspire the people around them. So we elevated a second form of intelligence, emotional intelligence (EQ), the capacity to listen, to empathize, to read a room, to understand people and not just information. For a while it felt as though we’d found the right equation. Artificial intelligence is forcing us to rethink the equation again. For the first time in modern history, we are dealing with systems that can outperform aspects of our own intelligence at scale. AI can synthesize enormous bodies of knowledge in seconds, and it can simulate emotional fluency convincingly enough that the line between authentic empathy and a well-tuned response is starting to blur. That raises an uncomfortable question: if intelligence can be generated and emotional fluency can be simulated, what’s left that is distinctly human? My answer is that the future will belong to people who cultivate not two quotients but five, IQ, EQ, TQ, WQ, and most importantly VQ, the Vision Quotient. In an age of artificial intelligence, vision may turn out to be the defining human advantage. TQ: The Trust Quotient Trust has become one of the most undervalued forces in modern life, partly because we talk about it as though it were something soft, likability, familiarity, a warm handshake. It’s none of those things. Trust is earned credibility under pressure. It is the confidence other people place in you when uncertainty rises and the stakes get real, and it is built slowly and lost quickly. In an environment flooded with misinformation, manipulated narratives, deepfakes, and algorithmic distortion, trust is no longer soft currency, it is closer to infrastructure. Institutions run on it, markets depend on it, and leadership without it doesn’t survive contact with a real crisis. AI may eventually simulate reliability in narrow ways, but it cannot carry moral accountability. Machines do not wrestle with conscience or sacrifice or the cost of being wrong. Human beings still decide whom to trust when the outcome actually matters, and they make that decision based on a track record only another human can build. WQ: The Work Quotient Hard work has quietly fallen out of fashion. We celebrate optimization, leverage, automation, and balance, and all of those are real virtues, but somewhere along the way many people started mistaking convenience for achievement. Work ethic isn’t performative exhaustion or the cult of the grind. It’s the discipline to carry a piece of work all the way through to completion, long after the excitement of starting it has worn off. Ideas are abundant; execution is rare; the gap between the two is almost always filled by someone willing to do unglamorous work for a long time. AI complicates this picture, because artificial intelligence has, for practical purposes, infinite stamina. It runs continuously, at speeds no human can rival, and it doesn’t get tired or distracted or discouraged. So if machines can outwork us mechanically, what becomes valuable about human work? Not volume. Commitment. Human work carries judgment and ownership, the ability to notice when something feels wrong even when the metrics say it’s fine, the willingness to take responsibility for an outcome rather than a task. A machine can process indefinitely, but it cannot care about a mission, and that turns out to be the part that matters. A lot of people are approaching AI exactly backwards. They are trying to beat machines at the things machines are being optimized to do: faster analysis, faster synthesis, faster production, faster output. That is a race no human will win, and it isn’t the race worth running. The real opportunity is to deepen the human capacities machines cannot meaningfully replicate, judgment, intuition, ingenuity, foresight, the ability to imagine possibilities before the evidence has caught up. This is where the conversation actually changes. VQ: The Vision Quotient Every transformational leap in civilization began with someone seeing what other people couldn’t yet see. An inventor pursued what colleagues told him was impossible. An entrepreneur built for a market that didn’t exist. A scientist trusted a hypothesis years before the data could confirm it. A statesman imagined reconciliation in a place where everyone else saw permanent enmity. History does not move forward because we process information efficiently. It moves because certain people can see around corners, and that capacity is what I mean by VQ. The Vision Quotient is the human ability to perceive possibility before proof exists, to connect intuition with imagination, to sense an emerging reality before the world has named it, to commit to something that data alone could never predict. AI may eventually generate sophisticated questions by detecting patterns in massive datasets, but generating questions is not the same as envisioning a future. Machines optimize the known. Human beings create what has not existed before. That distinction matters more than it might first appear. Artificial intelligence is trained on existing patterns and existing realities, and its outputs, however impressive, are extrapolations from what already is. Human vision often works by defying what is. The greatest discoveries in history rarely began with consensus; they began with people willing to imagine past what the world believed was possible at the time. No machine independently dreamed of flight. No algorithm envisioned democracy. No software set out to cure a disease before science understood the mechanism. Humans did, and they did it without infinite information, they did it with imagination, conviction, and the willingness to be wrong in public for a long time. The New Test of Leadership The leaders who thrive in the coming era will not just be the smartest people in the room or simply the most emotionally polished. They will be the ones who can hold all five quotients at once: IQ to understand complexity, EQ to connect with people, TQ to earn lasting confidence, WQ to execute with discipline, and VQ to imagine futures others cannot yet see. That combination is rare, but history has always belonged to rare combinations. Artificial intelligence will probably, in time, write faster than we, calculate faster than we, diagnose faster than we, and persuade faster than we. It will generate endless answers and reasonable simulations. What it will not do is independently envision a future that does not exist and summon the courage and sacrifice required to bring that future into being. That is why VQ will ultimately become the most important quotient of all. Because while AI may help optimize the future, only human beings can truly create it. View the full article

-
Layoffs used to be something that made a company’s stock tank. But after Block announced layoffs recently, its stock went up. And they weren’t the only ones: Snap did the same thing a few months earlier, as did Meta and Amazon. The common thread? They all cited AI as their reason for cuts. For CEOs staring down investor pressure, the playbook has become clear: invoke AI, slash headcount, and watch the ticker go up. I’m a CEO, and I’ve been laid off before. I now advise HR and benefits leaders at Fortune 500 companies as they plan, execute, and move forward after making workforce cuts. Here’s why I’m cautioning fellow executives against jumping on the “AI” layoffs bandwagon without thinking about it from every angle. Many ‘AI-driven layoffs’ aren’t really about AI A recent Goldman Sachs survey found that only 11% of clients were reportedly cutting jobs due to AI, while LinkedIn’s hiring data signals that AI isn’t directly leading to the hiring slowdown… yet. Some of the cuts we’re watching this year are mostly about overhiring in 2021 and 2022, a cooling economy, softer consumer demand, and product bets that haven’t paid off. But those reasons don’t sound all that glamorous on an earnings call; AI does. As Tech investor Terrence Rohan put it plainly in a recent interview: “Pointing to AI makes a better blog post. Or it at least doesn’t make you seem as much the bad guy who just wants to cut people for cost-effectiveness.” It’s hard to tell today where AI is the root cause of layoffs and where it’s basically a nice narrative wrapper. But here’s the problem: Your layoff story travels further than your stock pop. Having personally experienced a layoff, I know how painful and disruptive an involuntary exit can be. And, as a CEO who reports to a board every quarter, I still have to make hard calls like any executive. But how you make them and what you say about them is the part that matters. With that in mind, this is what leaders need to keep in mind when they are faced with communicating these difficult decisions.\ Remember what a layoff really means for all your employees How you explain a layoff matters more than the explanation gets credit for. For departing employees, remember they haven’t just lost a job and their income. They’ve also lost, in most cases, many other fundamental lifelines: health insurance, life insurance, retirement contributions, disability protections, and more. That’s before you count their daily routine, sense of purpose, and community. For the remaining employees: They know which teams got cut and what those people were working on. They’re nervous and they’re watching. The story you put in front of the market is directly telling your team what kind of company you are now and in the future. So how you talk about the decision and how you treat their departing colleagues speaks volumes, and directly translates into morale for the weeks and months ahead. In communicating any cut, the best leaders treat both classes of employees with the seriousness and respect they deserve, not as a transaction that might give them a stock boost. Your internal and external story should be one and the same If you told the market the layoff was about AI, and your people know it was about a missed product launch, you’ve just taught your company that leadership says what’s useful, not what’s true. That lesson doesn’t stay contained to one announcement. With the companies I see handling layoff announcements well, the words on the earnings call match the words in the exit packet. Departing and remaining employees alike see and hear an explanation they can understand and that makes sense to them, no matter how painful. And they also experience and witness a compassionate exit process, because treating them with dignity softens the pain of being on the receiving end of this decision. Remember: Investor praise ≠ public perception Most of us can recall a cringe-worthy public layoff gone awry. But when Perplexity’s CEO brushed off the severity of layoffs, the public backlash was swift. The counterintuitive truth about AI’s rise is that the stakes on brand perception are only on the up and up. As more companies build on the same small set of foundational AI tools, product output is starting to look the same. What you say and how you behave matters more, not less. While ChatGPT emerged as the dominant force, now Claude is making considerable headway, especially in enterprise sales. The consensus for why this is largely points to how the two position themselves and what they stand for, from Anthropic’s public fight with the Defense Department over model guardrails to OpenAI’s decision to run ads in ChatGPT. Buyers paid attention and they moved their money. Buzzwords and bandwagons are tempting to jump on, especially when every company is racing to prove it’s “AI-ready,” but they don’t always resonate with customers, employees, and enterprise buyers paying attention to a lot more than your earnings call. Be honest about what’s really driving these cuts If your cut is driven by macro conditions, say that. If a product was a total flop, say that. If you overhired during a bullish period, say that. The reality is, layoffs are a regular thing for any corporation, and none of those reasons are disqualifying. To Terrence Rohan’s point: saying it’s just AI may make you feel like less of the bad guy, but the effect is actually the opposite. What erodes trust is dressing up legitimate reasons in a scapegoat explanation because the market prefers that version. If AI is genuinely part of your cut, be specific about it It’s very possible, even likely, that AI plays some role in the cuts you’re making. But there’s rarely a time when it’s defensible to make your people feel replaceable. There’s a real difference between saying “we’ve invested heavily into AI and are restructuring around that shift” and “we’re replacing 400 human support roles with a trained model.” Most companies are doing the former but signalling it’s the latter. That’s where the trust breaks down. AI will reshape a lot of work over the next decade, and as the market absorbs it we’ll see more layoffs legitimately tied to it. That’s why it’s even more critical to be honest, clear, and specific now. For better or worse, most of us in leadership will have many more of these moments for quarters and years to come. If you make a habit of dressing up normal business decisions with a glitzier costume, sooner or later it will come back to bite you. How you talk about making cuts is the part that people actually remember, long after your stock is back to normal. And in the meantime, the people inside your company are listening. View the full article

-
According to a new report from Realtor.com, buying a new home could save you a ton of money in your first decade of homeownership. But those savings depend on where you live. On average, U.S. buyers who choose a new home end up with $25,335 in savings over the course of 10 years. That chunk of change could offset the higher price tag of a newly built home, even if it doesn’t show up as up-front savings. The hidden savings tied to buying a newer home can mostly be attributed to two major factors: energy costs and new systems that don’t require maintenance or upgrades out of the gate. New homes might lack the aesthetic charm of their classic counterparts, but they excel when it comes to energy efficiency. “Homeownership is not a onetime expense, and the ongoing costs of owning a home are where new construction really shines,” Joel Berner, senior economist at Realtor.com, said. “Buyers who focus only on the listing price are missing a significant part of the financial picture.” Older homes are much more likely to have drafty rooms that allow warm or cool air to escape, a phenomenon that adds up considerably when it comes to paying the bills. The same goes for older windows, which are more likely to have air leaks and single-pane designs that aren’t as effective at maintaining a controlled climate compared to the insulating boost from modern multipaned glass. Preexisting homes are also much more likely to come with aging cooling and heating systems that lack the efficiency of more modern systems. If an HVAC system, a water heater, or even a roof requires an upgrade a few years after buying, that’s one more hidden cost on top of a home’s asking price. National differences The perceived perks of buying a new home can shake out very differently depending on what corner of the country you live in. In New England, newly constructed homes save buyers the most on average—but those homes also list for a lot more. In Massachusetts, a new home spares buyers almost $39,000 in hidden costs within the first 10 years, but could command a price tag with a 47% premium compared to an older home. New Hampshire, Maine, Rhode Island, and Vermont aren’t far behind, saving new homeowners anywhere from $34,000 to $36,000, but only Vermont has a new-home premium under 45%. Because paying for heat accounts for the bulk of an average energy bill, New England’s exceptionally cold winters loom large for home shoppers there. Buyers who want to prioritize newly built options should break down the math in their area before diving in. While homebuyers in New England might not make their savings back given the high premium on new homes, that isn’t the case everywhere. Realtor.com found that buyers in 16 of the country’s 300 biggest metro areas could cover the higher cost of a new home with the amount of cash they’d save from unneeded repairs and lower energy bills within 10 years. The top markets that strike this balance include San Diego; Salem, Oregon; Madison, Wisconsin; and Billings, Montana. In the analysis, Realtor.com’s Berner explained that the anticipated new-home savings in these markets might actually add up to even more. “These savings estimates are actually conservative,” he said, noting that HVAC warranties, more flexible price negotiations, and rate buydowns can boost savings further. With electricity bills soaring nationwide, those factors can make a new home an enticing option for savvy homebuyers, depending on where they live. View the full article

-
Artificial intelligence isn’t just a headache for human resources. More and more, corporate legal teams are becoming entangled in the technology’s mistakes. Generative AI-related lawsuits in the United States grew 978% from 2021 to 2025, according to a report from the reinsurance broker Gallagher Re. But a growing number of insurance companies are removing AI liability coverage. Berkshire Hathaway, Chubb, and Travelers have all won approval to largely drop the protection in recent months. Technically, the companies have added “AI exclusion clauses” to their standard commercial liability policies. Those clauses cover a wide range of issues, including employees alleging AI-driven discrimination, intellectual property violations (such as AI using copyrighted material without a company’s knowledge), and property damage caused by autonomous or robotic systems. It’s a move that could leave many companies exposed to steep financial damages. It could also slow the corporate rollout of AI, as executives weigh whether the potential risks outweigh the technology’s rewards. “This is highlighting a crucial blind spot for businesses,” says Ifeoma Yvonne Ajunwa, a professor at Emory University’s School of Law. “They are clamoring to join the AI bandwagon, but they have to pause and ask if they’re fully protected.” Changes aren’t universal While Berkshire Hathaway, Chubb, and Travelers are major names in insurance, not every insurer is following their lead. HSB , in March, began offering AI liability insurance for small businesses. “All types of businesses are using AI to do things more quickly and efficiently,” said Timothy Zeilman, global head of product ownership for HSB, in a statement. “At the same time, the AI transformation brings new legal and financial exposures. Business owners may wonder, am I protected? AI insurance helps remove that uncertainty.” There are also a number of smaller insurers, some relatively new themselves, focused specifically on this area. Some have the support of established names, including Armilla AI (which counts Chaucer Group and Axis Capital among its backers). Others do not. That could further complicate matters if business owners don’t do their homework. “It is very much the wild west. It highlights the need for precaution,” says Ajunwa. “The main thing is to evaluate the company that’s offering this insurance. What is their capitalization? If they’re selling $10 million or $20 million in insurance, how much money does that company actually have? If the insurance is used, will you actually be reasonably confident of a payout?” Not without precedent While the moves by insurance companies are frustrating for founders and corporate boards, they shouldn’t come as a complete surprise. In the early 1990s, many insurers carved out exceptions for online activities as the internet became a standard part of daily life. That led to the rise of “cyber insurance.” Initially aimed at IT companies, those policies focused on issues like errors in data processing and online media risks before evolving into a broader specialty category. Another way to view the issue is by looking at the healthcare marketplace. Health insurers often decline to cover a new medical procedure, device, or drug until they are confident it will not cause more harm than good. Coverage typically comes only after a treatment has been thoroughly tested and established a reliable track record. AI, as you might imagine, does not yet have an enviable track record. And because only a relatively small number of companies provide AI services to corporate clients, a critical flaw in a widely adopted AI model could result in hundreds, or even thousands, of claims. That could keep major insurers on the sidelines for a while. View the full article

-
Tor Myhren is going to kind of hate this article. Because it’s about him, not his entire team. Because I want to talk about his shift from agency chief creative officer to leading marketing for the most pristine marketer on the planet, not to mention one of the world’s most valuable companies. Because I want to talk about how he’s been doing it for 10 years in an industry where brands change senior marketing executives as frequently as their socks. And because I want to start with the worst moment of his decade at Apple. At the time, Myhren had a singular focus. In early 2024, Apple’s VP of marketing communications was sitting with his team, thinking about how they should approach the rollout of the new iPad Pro, Apple’s thinnest and most powerful iPad to date. Myhren, whose job it is to help sell the products of one of the world’s most profitable and beloved gadget makers, zeroed in on an idea. “The idea was about the thinnest product we have ever made, and in the making of it, all I could see was thin, thin, thin,” Myhren says. The team ended up releasing a spot in May 2024 called “Crush.” It depicted a collection of creative tools—turntables, a piano, The Presidentet, cans of paint, a sculptured bust, an old arcade game, a mannequin for fashion design, a writing desk, camera lenses—all piled up in an industrial compactor. Then, to the melancholy tune of Sonny & Cher’s “All I Ever Need Is You,” the objects were slowly and methodically crushed into the iPad Pro. The ad bombed. It went viral for all the wrong reasons, and exposed a major blind spot for Apple. “Crush” aired in the early days of the AI hype cycle, and the ad fueled fears that new technological capabilities would replace creative professionals of all stripes and lead to massive job losses. Barely 48 hours later, Myhren publicly apologized for the spot and it was pulled. “When the world saw something other than what we intended in it, it was impossible to unsee,” Myhren recalls. Apple isn’t accustomed to making bad advertising. Ever since Steve Jobs and TBW\Chiat\Day’s Lee Clow created the iconic “1984” Super Bowl ad, Apple has been thought of as a world-class brand marketer. “Crush” was both a reality check and a gut punch. Soon after the ad was pulled, Myhren gathered his team in Menlo Park, and many of the global teams virtually, to talk about it. His message? This wasn’t the end of the world. More important: It wasn’t the end of creative experimentation at the brand. “If we start to play this game with fear, or get soft on our marketing, it’s going to hurt the brand a lot more,” Myhren told his team at the time. The pep talk wasn’t just for show; it was Myhren replanting the flag for how he expected his team to operate. When Myhren started in 2016, Apple was roughly a $540 billion company. Today, it’s worth around $4.3 trillion. He has overseen the marketing department during a period of hyper-growth for the company. As Apple’s products and ambitions have expanded into new categories like TV, headphones, watches, and services, its marketing efforts have kept pace. Myhren has built his success on ambitious creative consistency, and yet as he enters a new decade at Apple, he’s staring down big changes. In the fall, John Ternus will replace Tim Cook as CEO. At the same time, Myhren—like all heads of marketing—must grapple with AI-driven technologies that are upending traditional marketing and advertising. In this exclusive interview, I talk to Myhren about his first moves to meet the demand for faster brand work, why he believes in the “nail theory” of effective product advertising, the magic formula for AirPods advertising, and the one thing he didn’t change about how Apple works—even after “Crush.” “I’m super optimistic about the future of marketing,” Myhren says. “Forget five years. I think it’s going to be radically different in three years. Radically, radically different. And anyone who says they know what that’s going to be, they’re lying.” The Beginning When Myhren joined Apple as its VP of marketing communications in 2016, it came as a bit of a shock to the ad industry. Over the previous decade, Myhren, as chief creative officer, had transformed Grey Advertising, with its stodgy, old-school reputation, into one of the leading creative agencies on the planet, thanks to work like the now-legendary long-running E-Trade baby campaign. “At that time, there was no real precedent of an agency creative making a move like this,” Myhren says. “I foolishly thought my global role in a big agency network would prepare me for the size of Apple. I was wrong. It was a totally different scale and scope.” Michael Houston—former CEO at Grey, and currently the outgoing U.S. president of WPP—was Myhren’s boss at the time. He remembers exactly when Myhren told him he was leaving the agency. It was late 2015, and they were in a car skirting Switzerland’s Lake Geneva. They had just finished their annual “top-to-top” meetings with the leadership of Nestlé. By all measures, it had been a wildly successful meeting. When Myhren joined Grey New York in 2007 it was known as a Death Star of old-school advertising. By 2015, at the height of the agency’s turnaround, Grey had won 113 Cannes Lions across its offices in 18 countries. Everything was clicking. But on that drive, Myhren turned to Houston and told him he’d been speaking with Apple CEO Tim Cook. He was going to Apple. And that he wouldn’t have left the team at Grey for any other company. “Beyond processing the shock of the news, I remember sitting there thinking that the very things that had just made our . . . meeting so successful were the exact things that would make him right for Apple,” Houston says. A few months after Myhren returned from the Geneva trip, he packed his bags and moved to Cupertino, where he took over one of the most sophisticated marketing machines on the planet. Media coverage of the move aligned with Myhren’s assessment: It was an unusual move for an agency creative. But at the time, fellow ad legend David Droga told Adweek, “I think it’s a really great move for both parties, and only good things can come from this.” Apple could have gone in any number of directions in 2016 when looking for a new leader for its marketing communications division. R/GA was on a hot streak, and Nick Law, its chief creative officer, would’ve been an option. (Myhren brought on Law at Apple in 2019, where Law worked until late 2021.) Airbnb CMO Jonathan Mildenhall was also ascendant; he had joined the Silicon Valley company in 2014 after leading marketing and design for Coca-Cola in North America. But Myhren was a rare mix: He was an incredibly successful advertising creative who also grew his clients’ business, won all the awards, and did it in a quietly efficient way that never made him the star or focal point, which Apple undoubtedly appreciated. Houston describes Myhren as an exceptional listener, an introvert, a leader who understands the value of creative risk and that great work is a team sport. “More than anything, he’s one of the most effective motivators I’ve ever worked with,” Houston says. “He creates direction. Clarity. Which makes others willing to take the journey with him.” Solid Foundation In 1997, Steve Jobs introduced Apple’s “Think Different” tagline and its now iconic “Crazy Ones” ad campaign at an internal company meeting. As he spoke to a small audience about the campaign, Jobs articulated perfectly the role of marketing and advertising for the brand. “This is a very complicated world. It’s a very noisy world, and we’re not going to get a chance to get people to remember much about us. No company is,” he said to a half-full auditorium. Jobs and his creative team knew they had one shot to make an impact. The brand would have to be very clear in what it wanted people to remember. Instead of focusing on speeds, feeds, and other product details, Jobs said the brand’s core values would be at the center of everything. “Apple’s core value is that we believe that people with passion can change the world for the better,” he said. Jobs instilled that value into the brand work—so much so that it became part of the company’s DNA. And it was still going strong when Myhren got there. Myhren says his start at Apple was unique in that he wasn’t brought in to fix a stalled or sinking ship, as so many new marketers are. “I stepped into a company that, from a marketing standpoint, has just been rock solid forever, which in some ways is a little intimidating,” he says. His job was not only to steer the ship, but also to make sure it was being prepared for the future before it had to be. He points to the long-term relationship with Apple’s primary agency partners TBWA\Media Arts Lab (MAL) and OMD, as a huge reason he was able to settle in so quickly. “That working relationship was already solid, and I had come from that world, so I do think I was able to help instigate some changes that made MAL an even better fit for marcomm [marketing communications] that I was envisioning going forward, and the kinds of skills that we were going to need,” he says. Preparing for the future in 2016 meant supplementing agency work by building out internal advertising and content capabilities to match the ever-growing, always-on demand of a modern global brand. Soon, Myhren was enacting that vision and adding those skills. “I inherited the best design team in the world, and an incredible interactive team,” he says. “What I was able to bring to it was to build on the advertising side of things. So we did bring in some advertising folks after I got here and started doing a lot more advertising out of marcomm.” In order to keep up with the ever-increasing pace of brand work, he also brought in more “makers”—including CGI artists, directors, and editors—and established a production warehouse to create more content internally rather than relying solely on outside agencies. The first piece of work that really had his stamp on it was 2017’s “Stroll,” for AirPods. While it paid homage to the classic DNA of Apple’s music marketing—specifically the dancing and neon of the iPod/iTunes era—it added a modern edge, featuring street dancer Lil Buck in black and white. It was also the start of a clear formula for AirPods advertising. “If you think about all the spots, it’s music-plus-magic-plus-dance-equals-AirPods,” Myhren says. “It started with ‘Stroll,’ but then think about ‘Bounce,’ think about Pedro [2025’s “Someday”], and that’s what it is.” One thing Myhren didn’t change—and still hasn’t—is that Apple doesn’t market test its advertising. “You might not believe this, but we make almost all of our decisions through gut instinct,” he says. “When you talk about brand guardrails, there’s no book that says this is right or wrong. It is all gut. And I think it always has been, because we don’t test our work. At the end of the day, we put something into the world and it is gut, ‘This feels like us.’ This is capturing the product in a way that we want to, and we feel really good about.” For Myhren, and Apple more broadly, no one knows the brand better than the brand itself. Many, like Myhren now, have been at the company for many years. Even its primary agency partner TBWA has been working with Apple since 1984. “There are a lot of really smart people at Apple that have been at Apple for a long time,” Myhren says. “And so you’re always bouncing ideas off folks that have been there, that really know it, and do have their own set of guardrails.” That often leads to work that still does what Jobs set out to do—cutting through the noise in a complicated world. The flip side of instinct, however, is that sometimes the gut is wrong. Case in point: “Crush.” “The only other thing I will say about that is it was a bit heartbreaking to me as someone who has spent so much of my career trying to empower creatives and creative people and creative thinking,” he says. “To have something be seen as potentially harmful to the creative spirit was really tough for me.” A decade of work Apple’s marketing has always been product-led, but Myhren’s run has evolved the idea of the elevated product demo to unprecedented heights. “Crush” clearly stands out for its own reasons, and I’m on record for being no fan of 2023’s “Mother Nature,” or the Bella Ramsey AI spots in 2024. But over his decade at Apple, Myhren has steered more hits than misses, and has kept the company a step ahead and above most major marketers. He credits an almost maniacal commitment to making the product the star of any ad or brand work. “So many brands will start with culture and say, ‘What’s happening in culture? What’s happening in pop culture? What’s the trend right now?’ And that’s actually the starting point, and they work backwards,” he says. “We always start with the product. What is it about the product? One of the reasons we do that is we don’t want to do stuff where you remember the ad, but you don’t remember the product. In our best work, those two things are just synonymous together. When you’re talking about the piece, you’re talking about the product.” This approach shines in work like 2019’s “The Underdogs,” a tech ad-as-sitcom that seamlessly weaves an insane number of products into an impressive level of entertainment value. But Myhren also points to “Relax, It’s iPhone” which originally launched in 2021. “What stands out to me is taking one feature of a new phone that has 20 great new features and just zeroing in on it,” he says. He credits Tracy Wong at Wongdoody, who told him once that ads are like when you step on a bed of nails: Nothing penetrates because there are too many nails. It’s the same with advertising. If you step on that one nail, it’s going to make an impact. For 2022’s “The Greatest,” director Kim Gehrig beautifully dramatized Apple’s accessibility features across its products like VoiceOver, AssistiveTouch, Live Captions, Magnifier for Mac, and Braille Access. “These are seemingly small features that are radically changing people’s lives, and that’s what we try to bring to life,” Myhren says. “There’s an old belief that too much product makes for boring advertising, but I just don’t buy it. Again, I think that the product is like a character in the story. You couldn’t pull that product out and have the same story.” The ultimate product demo campaign is, of course, “Shot on iPhone,” which began in 2015 as an outdoor campaign that featured 77 photos from 73 iPhone users in 25 countries on billboards around the world. Under Myhren, it evolved to include full short films directed by Oscar-winning filmmakers. But despite the talent pedigree involved, it’s still a product demo. “Every single element of it and every piece we put out is evidence, not advertising,” Myhren says. “It’s just evidence of an amazing camera.” Myhren’s latest push on the brand’s edges is its move to finally have something to say on TikTok. The recent work made a splash aimed at Gen Alpha for the new Macbook Neo. It’s cute, colorful, and has spawned a new brand mascot people are calling Lil’ Finder Guy. “We’re not in the volume game; we try to stay in the quality game,” Myhren says. “I’m not saying that it always works and that it’s always great, but we kind of want to speak when we have something to say. And I think the MacBook Neo launch is a perfect example of that, of a perfect time and perfect audience to do a real deep dive into TikTok and pick our moment.” Perhaps one of the most underrated strengths of Apple’s marketing and advertising is its consistency. It doesn’t bounce around from vibe to vibe, trend to trend. It speaks its own language at its own pace. “Shot on iPhone” has been running for more than a decade, “The Underdogs” went for seven years, the brand’s privacy campaign has been going for seven years, and “Relax, it’s iPhone” is clocking in at six years. In an increasingly ephemeral culture, at its best brand consistency breeds familiarity, trust, and legacy. That is what Apple will need to draw on as its markets quickly evolve across new challenges, in AI and beyond. Collaboration and consistency One of the first things Myhren says when we start talking about his decade at Apple is that this milestone is definitely not just about him. He sees himself as a collaborative leader, someone who is able to bring together a variety of elements to create something successful. Brent Anderson, global chief creative officer at TBWA\Media Arts Lab, says that when presenting work to Myhren, he can regularly be heard asking any number of direct, sharp, and clarifying questions. “He’ll bluntly ask why anyone would care or pay attention to the idea in question, or how your idea is different than what someone else other than Apple could do. Or he’ll say that he thinks a particular idea could be good but will ask if we really think it can ever be great,” Anderson says. “If an idea survives this gauntlet of interrogation, he then provides the support and the trust that our teams need in order for the creative output to get to great.” Internally at Apple, getting to great has meant growing international creative teams as well as the brand strategy team. Myhren has added more internal editors, writers, and other makers. He also knows that it’s a blessing to be at a brand that major Hollywood directors and global artists actually want to work with. He sees collaborators like directors Spike Jonze, Damien Chazelle, David Shane, Mark Molloy, and Kim Gehrig, and artists like Billie Eilish, Lady Gaga, and Olivia Rodrigo as essential to maintaining the brand’s “human touch” in a technology-saturated market. The success of Apple’s brand work is down to a collective of these big names, his internal team, and the external agency partners like MAL and OMD. “What’s most impressive about his run at Apple is that he’s proven something very few people can—that creativity doesn’t have to get diluted at scale,” says Houston, his former boss. “In the right hands, it can actually get stronger.” Most chief marketers who have come over from the ad agency world do so from account management, the folks who are the bridge between the brand’s business and its creative. But in hiring a CCO like Myhren, Apple knew it was getting a guy who liked to be as close to the work as possible. Someone with the creative eye and instincts to build on the foundation it already had. When I ask him to explain his longevity at Apple, Myhren says one key aspect is that it’s actually a very patient company. “I’ve learned a lot from that because I wasn’t a patient person coming into Apple,” he says. “And then you realize, hey, you don’t have to always be first; you have to be best. Take your time. No big rush. It does help to know that you can let it play out a little bit.” In an industry and culture overwhelmed by a spinning news and culture cycle, now awash in the onslaught of AI-infused work, that’s definitely still thinking different. View the full article

-
Below, Dan Pontefract shares five key insights from his new book, The Future of Work Is Grey: The Untapped Value of Age in the Workforce. Pontefract is a six-time award-winning author and a leadership and corporate culture strategist. He has spent more than 20 years in senior leadership roles at TELUS, SAP, and BCIT, serving as a chief learning officer and chief envisioner. In 2018, he founded his own firm, the Pontefract Group, to help leaders and organizations improve leadership and corporate culture. What’s the big idea? Organizations are overlooking a major, unavoidable shift—the aging workforce—and those that learn to value and integrate people of all ages will outperform those that ignore it. Listen to the audio version of this Book Bite—read by Pontefract himself—in the Next Big Idea app, or buy the book. 1. Demographics don’t care about your organization’s strategy. According to the World Economic Forum, workers aged 55 and older will make up more than 25 percent of the G7 workforce by 2031. That’s roughly a 10-point jump from 2011. And between you and me, I think the forum is underselling the number. My money says it will be higher. Here’s what nags at me. Every boardroom, leadership room, and workshop I’ve sat in over the last few years has been obsessed with two topics: artificial intelligence and cost control. Remarkably, neither conversation has included the one demographic fact already reshaping the labor market: The workforce is greying, and it’s happening fast. Organizations are bracing for a robot revolution while quietly ignoring (or not even knowing about) the humans that are about to reshape them. Demographic reality is the one trend you cannot disrupt, downsize, or delay. Older workers are not optional. They are the scaffolding holding up skills transfer, institutional memory, and cultural continuity across every workplace on the planet. You cannot and will not automate your way out of a people problem. The future of work will be grey. 2. Meet the rivers, rocks, and rubies. While writing this book, I kept bumping into the same clumsy intergenerational dance. Younger workers were dismissed as naive. Older workers were dismissed as obsolete. And the folks in the middle were catching friendly fire from both directions as part of the sandwich generation in the workplace. So, I thought a metaphor might make more sense, particularly given how unhelpful it is to classify workers by generations in the workplace: Rivers are your early-career employees. They move fast, change course often, and make some mistakes, but they carry the kind of energy your organization desperately needs—what psychologists call fluid intelligence. Rocks are your mid-career professionals. They are the load-bearing walls of the organization. They are steady, thoughtful, and quietly carrying execution on their backs. Rubies are your seasoned employees, full of what psychologists call crystallized intelligence. They hold institutional memory, hard-earned judgment, and a phone book of relationships worth more than any CRM. Most organizations get policy design wrong. They build programs, perks, and promotions for one cohort at a time, as though rivers, rocks, and rubies exist on separate floors breathing different air. Well, they don’t. A healthy organization looks like a riverbed. Rivers flowing over rocks, polishing rubies, shaping one another by proximity. When you treat a ruby as an expense to be managed rather than an asset to be mined, you lose a library disguised as an employee. When you treat a river as an intern instead of a colleague, you lose the one question that would’ve exposed your outdated assumptions. And when your rocks burn out from mediating between rivers and rubies, while also tending to young kids and older parents outside of work, then you have lost the plot. The age crisis is real. The generational labels we keep using are not. Stop sorting people by decade of birth and start paying attention to the riverbed. 3. Ageism cuts both ways. At 27 years old, I walked into a university faculty washroom during my first week on a new job. An older gentleman at the sink looked me up and down and said, “What are you doing here?” I held up my lanyard. “I work here,” I replied, with a face somewhere between puzzled and iridescent. He dried his hands and said, “Interesting. I didn’t know we were hiring such young people these days.” What a shame. I said nothing and went to my meeting, but the comment obviously still lingers because I’m telling the story a quarter of a century later. Ageism does not only point in one direction. We discriminate against the grey and we discriminate against the green. In 2007, Mark Zuckerberg of Facebook told an audience at Stanford, with a perfectly straight face, that “young people are just smarter.” One year later, he hired Sheryl Sandberg, 15 years his senior, to help him run the company. Or how about 2019, when the “Okay boomer” meme started trending? It did nothing to help the cause. It just added a digital raspberry to a stale conversation. Every major study and research paper on the subject tells the same story. Age-biased workplaces lose more talent, innovate less, and collapse faster under demographic pressure than organizations that treat age as neutral or even positive. And yet, I would wager that every listener right now has witnessed an age-coded remark this year about a junior colleague, a senior colleague, or a middle-aged professional trying to keep it together—or themselves. Ageism is rampant. It may also be the last of the isms we are willing to admit to. 4. Mentorship is multidirectional. The year was 2009. The Black Eyed Peas were crushing it with their song “I Gotta Feeling.” I was 38 years old. I was mid-career at TELUS as the chief learning officer, overseeing leadership development and corporate culture. That year, I discovered a cluster of so-called older employees quietly producing some of the most useful internal learning content for the organization. They were using video cameras and our in-house habitat video system, which was kind of like YouTube. No prompt, no playbook. These people were just all about purpose. I’d be lying if I said I had proactively considered it because I hadn’t. I was supposed to be guiding the organization, but it turned out they were teaching me. The real lesson is not who teaches whom. It is that knowledge transfer in the modern organization runs like a roundabout, not a one-way escalator. Every era holds a lane. Rubies carry judgment and networks. Rocks carry execution and memory. Rivers carry fresh eyes and new concepts, and they may break stuff, but that’s okay because we’re all learning. When you build your organization around a single direction of mentorship, you’re going to break three out of every four knowledge flows available to you. The most intergenerationally healthy organizations I studied did something beautifully boring. They intentionally paired people across age groups. A 24-year-old would coach a 56-year-old on AI tools, and a 56-year-old would coach the 24-year-old on customer empathy and how to recover from a bad boss. Flatten your org chart by age, and you will create a fabulous culture. You may be surprised by who the real students are, too. 5. From grey to gold. A few years ago, I sat down with one of my mentors, Roger L. Martin, one of the finest management thinkers alive and the former Dean of the Rotman School of Management at the University of Toronto. We were stress testing the argument of this book. He listened, he nodded, and then he said something I have not been able to shake. He said, “Organizations recognize the aging workforce challenge. They see it clearly, Dan, yet they lack the tools to meaningfully respond. It’s like the drunk searching for keys under the streetlight, because that’s where the light is, even if the keys aren’t there.” I took that from Roger as a challenge. There is a path for leaders who know the demographics are shifting and who want to stop fumbling in the dark. The age crisis is not a problem to be solved once and shelved. It is a standing commitment, renewed daily, monthly, quarterly, yearly, and visible in how you hire, develop, compensate, and, importantly, how you shape the culture that holds it all together. Here is the promise hiding inside the age crisis: Organizations that treat age as a strategic advantage, rather than a scheduling headache or worse, nothing at all, will outperform their peers on retention, innovation, engagement, and trust. Teams that deliberately mix their rivers, rocks, and rubies will make better decisions, probably faster. Countries that invest in older workers will build more productive, stable, and prepared economies. The firm that stops exacerbating age debt and starts shifting toward inculcating the experience dividend will be the firm that future-proofs itself. In sum, the future of work is grey. It is inevitable. It’s happening. But when organizations and leaders, and maybe you, agree to treat the grey as a golden opportunity, that age debt will become a handsome experience dividend. Enjoy our full library of Book Bites—read by the authors!—in the Next Big Idea app. This article originally appeared in Next Big Idea Club magazine and is reprinted with permission. View the full article

-
On May 12, Unitree Robotics founder Wang Xingxing climbed into the chest cavity of a 9.8-foot-tall metal robot, walked around, and destroyed a concrete brick wall. One punch. Wall gone. The Chinese media reaction was instant: “Unitree really built a ‘Gundam’!” That was a wild exaggeration, but there’s a kernel of truth to it. The GD01 feels like the first version of something much bigger. Not in size, but in scope. China is waging a full-spectrum push into embodied AI—“digital brains” with physical bodies that perceive and act on the real world—and it’s playing out simultaneously across daily life, logistics, heavy industry, medical care, and military applications. Behind the spectacle of this new giant robot an entire industrial ecosystem is already quietly reshaping the country’s mining, manufacturing infrastructure, airport terminals, and high-voltage power grids. We are at the very beginning of this shift, and its practical consequences are only starting to surface. Built from a skeleton of titanium alloy and aerospace-grade aluminum with a carbon fiber shell, the GD01 is designed and engineered almost entirely in-house by Unitree—a company that, alongside fellow Chinese startup AgiBot, has emerged as arguably the world’s most consequential robotics manufacturer. First of many GD01 weighs 1,102 pounds and is priced at roughly $574,000. The company calls it the “world’s first mass-produced transformable mecha,” a title that is accurate. While some amateur fans have built mechas before, those units weren’t designed for work but rather for show, and none of them had the extraordinary capabilities and dexterity that GD01 shows. The robot transitions between two movement modes: upright on two legs or down on all fours. That four-legged mode works exactly like you’d expect: Drop the center of gravity, spread the weight across four contact points, and the machine stays stable over rough terrain that would tip a bipedal rig flat on its face. Watching it advancing in that mode (the demo footage shown in the launch video runs at normal, unedited speed) makes me feel strangely uneasy. The way it advances like a hellish predator freaks me out. An integrated AI system handles the spatial awareness and real-time limb coordination required to pull this off without the pilot needing to drive it manually. In bipedal mode, it works like any other humanoid bot you may have seen so far. Unitree claims it’s targeting the GD01 at “high-value markets” at this point: cultural tourism, private use, emergency rescue, and “industrial special operations.” But the shape of what comes next is obvious. A piloted exo-frame that can walk, transform, and punch through walls is a direct ancestor of machines that could operate construction sites, perform heavy maintenance on bridges and dams, work inside nuclear plants or collapsed mine shafts, and move massive loads in industrial ports. And given how thoroughly the People’s Liberation Army is embedded in Chinese companies like Unitree, a military evolution of this platform—autonomous or copiloted, armed or not—isn’t a stretch of the imagination. Eating everyone’s lunch The GD01 is the splashiest product in a portfolio that’s leaving Western robotics competitors behind. In 2025, Chinese companies captured almost 90% of global humanoid robot sales, according to research firm Omdia. Unitree alone shipped more than 5,500 humanoid robots—exclusively counting actual deliveries to end customers, per the company’s own official clarification—making it the world’s top shipper of humanoid robots for the year. Over that same period, American competitors Tesla, Figure AI, and Agility Robotics each managed to deliver roughly 150 units. The price gap tells the rest of the story. Unitree sells its base bipedal G1 and R1 models directly to international buyers through AliExpress, targeting customers in North America, Europe, and Japan, with the R1 starting at under $5,000 in some configurations. Elon Musk has publicly estimated his Tesla Optimus will eventually land somewhere between $20,000 and $30,000. Plus, Chinese humanoids are already doing real work in global infrastructure. Japan Airlines, in partnership with GMO AI & Robotics, is running live trials of Unitree’s G1 robot at Tokyo’s Haneda Airport to physically handle passenger bags and cargo on the tarmac, with the testing phase set to run through 2028. In December 2025, CATL—the world’s largest battery manufacturer—launched what it calls the first large-scale humanoid robot deployment in a commercial factory, at its plant in Luoyang, China. Last week, the State Grid Corp. of China kicked off a $1 billion plan to deploy a humanoid workforce to maintain its electrical grid autonomously. And just a few days ago, across the East China Sea, Japan Airlines began testing humanoid robots to handle luggage at Haneda Airport. Perhaps now that President The President is in Beijing, Chinese authorities will show him an impressive demo that will prompt his administration to make robotics a strategic industry for the United States. Otherwise, we are seriously risking both our future economy and security. There is no doubt that embodied AI will be the fastest-growing industry in the coming years, taking over every aspect of our lives. The Western world can’t afford to stay out of the most important technology race since the industrial revolution. View the full article