ResidentialBusiness
Administrators
-
Joined
-
Last visited
Everything posted by ResidentialBusiness
-
 If you’re working in project management, then you know about Monday.com. You’re probably getting a ton of online ads. The company has invested a ton of money in its marketing to people working on projects. But is there a Monday Gantt chart? Let’s take a look at this popular project management software and see if it delivers on one of the most essential project management tools. We’ll avoid the question as to why Monday.com named itself after the most hated day of the week and leave that for another time. What Is Monday.com? Monday.com bills itself as a work management tool. It says its purpose is to help teams and their organizations work more efficiently. It does this with features that track projects and create workflows, adding automation and visual data. But it’s mostly a collaborative tool. This highly customizable tool is understandably popular as it has a forever-free plan. Its modern look appeals to a wide range of consumers, and there are tons of templates to create boards and automation. It integrates with a lot of other apps. Plus, there are bells and whistles that the general public will enjoy, such as animated fireworks when you complete a task, though this isn’t likely to sway project management professionals. But what about that all-important project management tool, the Gantt chart? It’s not unusual that the free plan is limited to two users and doesn’t have a full suite of features. Less unusual is the confusing pricing plans. But for our discussion, it all boils down to one question. Does Monday.com Have a Gantt Chart? Why is the question of a Monday.com Gantt chart so critical? That’s because Gantt charts are the go-to tool for scheduling and planning a project. True, agile teams aren’t going to be interested in Gantt charts, but the upper management who oversees them will likely be working on Gantt charts. Yes, Gantt charts are best for traditional, waterfall methodology, but with cross-functional teams, you need a full array of project tools at your disposal, not just task lists or kanban boards, as important as those tools are. Gantt charts are like spreadsheets with the right side populated with a timeline showing the entire project. Related: Best Gantt Chart Software Rankings More than just a visual tool, they can link dependencies to avoid costly delays, set milestones to help with project tracking, organize tasks, resources, costs and much more. They break projects into phases to make them more manageable. Few project managers would want to run a project without one. So is there a Monday.com Gantt chart? Short Answer: Yes, Monday.com Has Gantt Charts There is a Monday.com Gantt chart. It can be used to track project plans, monitor your progress and measure against your objectives. Monday.com Gantt charts are good to manage any business or personal work. That’s true, in the most rudimentary way. /wp-content/uploads/2023/10/monday.com-gantt-chart-2.webp Long Answer: Monday.com Gantt Charts Lack Key Features for Project Management Monday.com’s Gantt chart meets the minimum requirements to make a project timeline, but it can’t really be considered a Gantt chart tool that project managers can use to plan, schedule and monitor their projects. If you’re looking for a powerful Gantt chart that can help plan, manage and track projects in real time, you’re looking for ProjectManager. Our award-winning project management software has robust Gantt charts that do everything Monday Gantt charts do and so much more. It’s easy to drag and drop all four types of task dependencies, you can filter for the critical path and set a baseline to track project variance in real time. That data is shared across the app, such as in real-time dashboards, timesheets, workload charts and much more. Get started with ProjectManager today for free. /wp-content/uploads/2022/07/Construction-Gantt-Task-Info-CTA-BUTTON-1.jpgLearn more Monday.com Gantt Chart Features The monday.com Gantt chart offers an intuitive visual timeline for planning and tracking projects. Teams can easily adjust task durations, set dependencies and visualize progress using customizable colors and layouts. With real-time collaboration, drag-and-drop scheduling and baseline comparisons, it helps users manage timelines and keep all stakeholders aligned on project milestones. Drag-and-drop task bars to adjust schedule. Create and manage task dependencies and milestones. Critical path calculation and visualization. Baseline snapshot feature to compare actual vs planned schedule. Customize time-scale view (days, weeks, months, quarters). Import tasks from Excel to board and convert into Gantt view. 100% customizable visuals: colors, labels, layout. Real-time updates and collaboration across teams. Integrations with other tools and workflows/automation support. View subtasks/items within Gantt view. Setting different groups for tasks/tasks phases and grouping in Gantt view. What Project Management Features Is Monday.com Gantt Chart Missing? While monday.com’s Gantt chart is sleek and user-friendly, it lacks several core project management capabilities. It doesn’t include resource allocation, cost tracking or workload balancing tools. Features like earned value analysis, cross-project dependencies and forecasting are missing, limiting its use for advanced performance analysis or comprehensive schedule and cost management. Monday.com’s Gantt chart does not allow users to allocate resources directly to project tasks. It does not provide workload balancing or resource capacity views. Estimated vs. actual cost tracking for tasks is not supported within the Gantt chart. Baseline creation and variance tracking are limited to schedule only—no cost or performance baselines. It does not offer a percent-complete column for tracking task progress numerically within the chart. Task prioritization indicators (e.g., high, medium, low) are not displayed in the Gantt view. Dependencies are restricted to simple finish-to-start logic, with no lead/lag time configuration. Cross-project dependencies are not supported. Risk management indicators (probability, impact, mitigation) are not visualized in the Gantt. Automatic recalculation of schedules after dependency or duration changes is limited. How To Make a Monday.com Gantt Chart Better With ProjectManager If you’re stuck using Monday.com but want to experience the full range of what a Gantt chart can do, there’s a workaround that can free you from the constraints of a Monday.com Gantt chart. ProjectManager makes it easy to take your project from Monday.com and import it into our software, freeing you to use a Gantt chart the way it should be used. /wp-content/uploads/2024/05/monday-pm-integration-1600x627.png To get started, visit ProjectManager and take our free 30-day trial. There’s no credit card needed. It’s completely free and you’ll get access not only to our free Gantt chart software, but also task management, risk management and resource management features, plus multiple project planning views, real-time dashboards, timesheets and many more valuable project management tools. But before we dive into the process, let’s compare Monday.com’s Gantt chart and ProjectManager’s Gantt chart. monday.com Gantt Chart ProjectManager Gantt Chart Drag-and-drop task bars to adjust schedule Drag-and-drop scheduling with automated dependency updates Create and manage task dependencies Four types of task dependencies (FS, SS, FF, SF) Critical path calculation and visualization Critical path analysis built-in with real-time visualisation Milestones support Milestones, subtasks, and percent-complete tracking Baseline snapshot feature to compare actual vs planned schedule Baseline vs actual schedule and cost tracking Customize time-scale view (days, weeks, months, quarters) Time-scaled view with duration, start/end dates, and schedule variance Import tasks from Excel to board and convert into Gantt view Import MS Project, CSV, Excel and convert to live Gantt 100% customizable visuals: colors, labels, layout Custom colours, labels, layouts plus advanced visual filters Real-time updates and collaboration across team Real-time team collaboration + schedule, cost and resource integration Integrations with other tools and workflows/automation support Wide integrations + built-in reporting, resource & cost modules View subtasks/items within Gantt view Tasks, subtasks, WBS hierarchy supported Grouping by task phases and setting groups in Gantt view Supports WBS, phases, grouping and multi-project rollups Filter and drill down into items within Gantt Interactive filters, drill-down, analytical dashboards included Does not allow resource allocation, workload balancing Built-in resource allocation and workload tracking Does not support estimated vs actual task cost tracking Allows cost estimation, actuals, variance tracking Baseline vs cost/performance variances limited to schedule only Schedule and cost baselines & variances supported No multi-board/cross-project dependencies without workarounds Cross-project dependencies and portfolio Gantt views supported No what-if scenario modelling or simulation What-if modelling and schedule simulations available Progress tracking visual only, no built-in percent-complete or trend metrics Percent-complete, variance trends and analytics built into Gantt Export & Import Your Monday.com Projects Pick the project from Monday.com that you want to export. Save it as a CSV or Excel file. Now it’s ready to be imported into ProjectManager. /wp-content/uploads/2022/03/Import-Projects_Wide_Zoom-175-e1666881352785.jpg Choose the Excel File Log into ProjectManager and toggle to the Gantt chart where you’ll see an import button. Click it and a window will pop up that says “Import a Project.” Click “Select File” and find your Monday.com project and select it. Select Options Now that your Monday.com file is uploaded to ProjectManager, you’ll want to decide if this is going to be a new project or if you’d prefer to add it to an existing project. If you’re adding to an existing project, be sure to note whether to keep the existing data or delete it. Import What Data? The last step is to either import all the data from your Monday.com file or only the task list. Select the one you want to import and click next. Create a Gantt Chart! When you see the “Success!” window, that means you’re done. The Monday.com file has been imported and you’re ready to use a real Gantt chart in ProjectManager. Now you’ll see what a real Gantt chart can do. It’s packed with features and connects to the rest of your project management software. /wp-content/uploads/2021/05/project-has-been-imported-1-e1666795487575.jpg Monday.com Gantt Chart Pricing The Gantt chart view in Monday.com is available starting from the Standard plan. It’s not included in the Free or Basic plans, which can be limiting for smaller teams or individuals managing simple projects. Paid tiers unlock timeline and Gantt functionality along with more advanced features. Free Plan: Monday.com Gantt chart is not included in this pricing plan. Basic Plan ($9/user/month, billed annually): Monday.com Gantt chart is not included in this pricing plan, which only offers basic dashboards and views. Standard Plan ($12/user/month, billed annually): Monday.com Gantt chart is included in this plan with timeline and dependency features for task scheduling. Pro Plan ($19/user/month, billed annually): Monday.com Gantt chart is included in this plan with additional capabilities such as advanced dependencies, formulas, and time tracking. Enterprise Plan (custom pricing): Monday.com Gantt chart is included in this plan with portfolio management, resource management, and advanced reporting features. What Can You Use a Monday.com Gantt Chart For? The monday.com Gantt chart is primarily designed to help teams visualize their project timelines. It provides a clear, interactive way to map out tasks, deadlines and dependencies, making it useful for presenting schedules and ensuring everyone understands the project’s flow. However, its role ends there. The monday.com Gantt chart functions mainly as a visual planning aid rather than a true project management tool. It lacks the advanced capabilities needed for complete project control, such as resource allocation, workload balancing, cost tracking and progress analysis. Users can see when tasks are due, but not how delays or cost overruns affect the overall plan. There’s also no built-in functionality for forecasting, performance measurement or detailed reporting. While it’s helpful for creating attractive, easy-to-read timelines, monday.com’s Gantt chart falls short of what project managers need to fully plan, schedule and monitor a project’s performance from start to finish. How to Use Your Monday.com Gantt Chart in ProjectManager Now let’s look at what ProjectManager can do when you use your Monday.com Gantt chart in our software. For one thing, our Gantt chart seamlessly integrates with the rest of our project tools. You can share the Gantt chart with your team and stakeholders, track progress and performance on real-time dashboards and even auto-fill timesheets. But before we start showing off the features of the Gantt chart, let’s focus on what our Gantt chart can do. It’s a powerful tool unto itself, which is cheaper than the 40-percent price increase that Monday.com implemented in 2022. With our software, it’s easier to onboard and train your team and it has impressive reporting functionality. You can’t even link tasks between boards or add holidays to know your team’s availability. Here are some other noteworthy aspects of our Gantt charts. Set Milestones for Your Progress Milestones are important dates in your project and they show up on our Gantt chart as diamond icons. Simply point and click when you want them. They’re great to indicate important deliverables, such as delivering the project plan to the client for approval. Traditionally, they’re used to mark the end or the beginning of a project phase. This is helpful in that it allows you to track your progress and make sure you’re keeping to the schedule. /wp-content/uploads/2022/09/Marketing_Gantt_Milestones.gif Filter By Priority, Dependency and Tags A big difference between Monday.com and ProjectManager is when you want to link task dependencies or work that can’t be done until another task is either started or finished. Our software makes it easy to link dependent tasks, Monday.com doesn’t. We also allow you to link all four types of dependencies. There are also customized tags, priority levels and more you can add to tasks to make them easier to find. Just filter the Gantt chart by what you want to see, such as the critical path in the screenshot below. It’s that easy. /wp-content/uploads/2022/03/gantt-with-the-critical-path-filtered.jpg Our Gantt Chart is All Yours What a pleasure it is to use a Gantt chart that works with you instead of against you. Monday.com’s Gantt charts are one in a long line of difficult Gantt charts. Remember, people used to make these by hand. Even on a spreadsheet, they’re complicated and aggravating to edit and almost impossible to share. You don’t want multiple copies with different data floating around. /wp-content/uploads/2022/07/Construction-Gantt-Costs-Resources.jpg You’ll find none of those roadblocks when you plan, manage and track your project on our software. Our Gantt chart is easy to share. You can edit by simply dragging and dropping. All associated tasks automatically update to reflect the change. You can add color to make it easier to see the different project phases and much more. Get Notified of Progress Because our software is online, our Gantt chart always has up-to-date information that is shared across our multiple project views. You’re always working on the same page as your teammates, whether they’re in the next office or next time zone. You can share files, comments and more to foster collaboration. For example, anytime the Gantt is changed or a task is commented on, you’re instantly notified by email and there’s even an in-app alert so you don’t have to leave the tool. /wp-content/uploads/2022/03/Notifications_Wide_Zoom-175.jpg Other Project Management Features From ProjectManager Now that you’re loving our Gantt chart, why not take a look around the software and see what else we have to offer? You can set availability when you onboard your team to make assignments easier, balance the team’s workload to keep them working at capacity, boost productivity and so much more. Kanban Boards While project managers love Gantt charts, project teams don’t need that level of engagement with the project. They want to do their tasks, which is why we have multiple project views, such as task lists, calendars and the visual workflow tool of a kanban board. The kanban board lets teams manage their backlog and plan sprints together, while project managers get visibility into their work and can reallocate resources to remove roadblocks to keep the team working uninterrupted. /wp-content/uploads/2022/11/Kanban_Marketing_Wide_Zoom-150_Moving-task-to-different-status.jpg Real-Time Dashboard We’ve talked a little about the real-time dashboard, which automatically collects live project data and displays it on easy-to-read graphs and charts. It gives you a high-level overview of the project’s progress and performance across a number of key metrics, such cost, time and much more. Most project management software makes you build your own dashboard, which takes time away from managing the project. Not our software. ProjectManager has a dashboard that’s ready to go whenever you toggle over to view it. /wp-content/uploads/2022/11/project-management-dashboard.webp Team Management Resource management is another key feature of our software. As we noted, we make it easy to onboard your team, define their skills and chart their availability, including PTO, vacation and global holidays for distributed teams. Once you’ve assigned the team, toggle over to the team page and get an overview of everyone on the team and see what they’re working on. To go deeper, there’s a workload chart where you can reallocate your team’s resources to keep them balanced and secure timesheets to see how far they’ve gone in completing their tasks. /wp-content/uploads/2022/03/TeamManagement-CLOSEUP.jpg Related Content Best Monday.com Alternatives Monday.com vs. ProjectManager ClickUp vs. Monday: In-Depth Software Comparison ProjectManager has more powerful Gantt charts than Monday.com. Our Gantt charts do more, do it better and do it seamlessly with our other project management features. If you need a Gantt chart, but also kanban boards, task lists, calendars and more you’ve come to the right software solution. Add to that our robust risk management, task management and resource management features and we give you the control you need to deliver successful projects. Get started with ProjectManager today for free. The post Monday.com Gantt Chart: A How-to Guide With Pros, Cons & Alternatives appeared first on ProjectManager. View the full article
 -
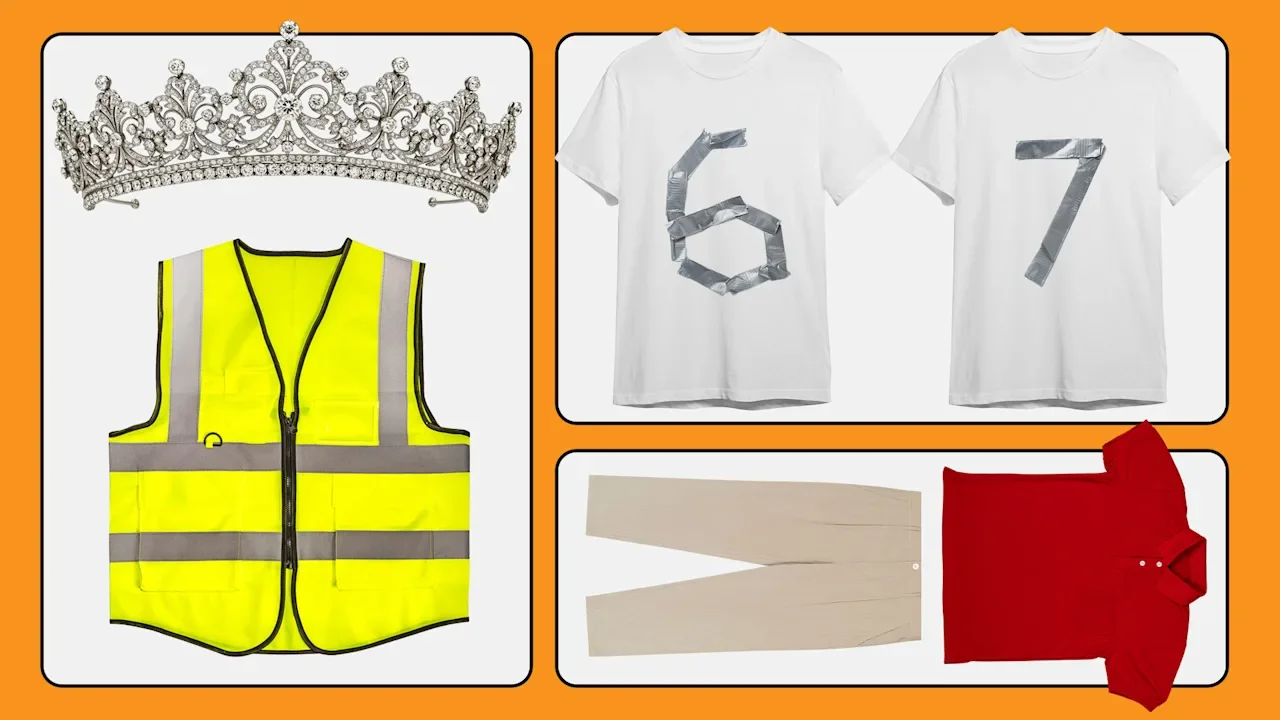
Every single day, the average working person plays many roles: sassy coworker, office comedian, and deadline stickler, to name a few. The labor doesn’t stop when one gets home—with new job titles coming into play, such as mom, brother, pet parent, and more. On Halloween, you get to choose which character you want to inhabit instead of having society dictate your role. This frivolity requires forward thinking and planning. If you find yourself running out of time, popular culture and a few easy-to-obtain items can come to the rescue. Here are nine easy costume ideas that range from classic to timely. The Louvre museum robbers This one is perfect for last-minute Halloween planners, as the true-life events surrounding the costume happened a little over a week ago. On Sunday, October 19, four robbers dressed up as maintenance workers and stole the French crown jewels from the Apollo Gallery at the world-famous Louvre Museum in Paris. The internet had a field day with this. The heist only took about seven minutes, security at the museum was severely lacking, and it occurred during regular business hours. To pull off this current event costume, all you need is a reflective maintenance vest, fake costume jewelry, and a tiara. You can wear these accessories on an all-black outfit base. Labubu These furry collectible toys really took off in 2024 despite being around for almost a decade. Artist Kasing Lung created the creepy yet cute characters in 2015 and introduced them in the book series The Monsters. Celebrity endorsements helped move the creatures into the cultural zeitgeist, with K-pop star Lisa from Blackpink leading the way. The easiest way to dress up as this popular plush toy and/or mini key chain accessory is to start with a onesie base. From there, you can get creative with premade bunny ears and makeup. Between your local Spirit Halloween store and Amazon, you should be able to obtain everything you need. Jake from State Farm This is one of the easiest looks on this list. You may even have all the costume pieces in your closet already. State Farm Insurance first introduced a real-life employee in its commercials in 2011. His name was Jake Stone. In 2020, actor Kevin Miles began playing the character in an effort to modernize the advertising campaign. All you need to pull off this look is a red polo and khakis. Bonus points if you have a name tag that introduces your character as well. Glinda and Elphaba Wicked: For Good will be released in movie theaters in the United States on November 21, ending the longest intermission in musical theater history. To celebrate all things witchy, consider dressing up as one of the movie’s leading ladies: Elphaba or Glinda (aka Galinda, before she drops a letter in Wicked: Part 1). You can even keep it minimal by wearing a simple green or pink outfit. If you want to bust out the green makeup and body paint, though, more power to you. Joel Goodsen from ‘Risky Business’ This costume will take some guts to pull off and might get a bit chilly, but it’s an easy one. In the 1983 film Risky Business, Tom Cruise plays a straight-laced high school senior named Joel Goodsen who cuts loose when his over-protective parents leave town for a couple days. His first act of rebellion is dancing around the house in a pink Oxford shirt, white socks, and briefs to “Old Time Rock and Roll” by Bob Seger. This scene is so iconic that most will recognize the dance moves if you commit by sliding around in your socks. Plus you don’t even need pants—although that could make for an awkward Uber ride. Mark and Helly from ‘Severance’ This Apple TV-inspired couple costume is more office friendly than the pantless option. Severance is of course the hit science fiction series that puts a whole new spin on the term work-life balance. Employees of Lumon Industries have undergone a process that creates two personalities living in the same body: a work personality called an “innie” and a personal life persona called an “outie.” The two are not aware of each other. At the center of this story are the couple Mark, played by Adam Scott, and Helly, played by Britt Lower. To dress up as Mark’s innie, all you need is a blue suit and Lumon Industries ID badge. To go as Helly’s innie, all you need is a pencil skirt, blue turtle neck sweater, and a Lumon Industries ID badge. Damian from ‘Mean Girls’ While this costume idea has been around since the hit 2004 movie Mean Girls came out, the classics endure for a reason. It is also so simple to pull off. Damian Leigh is the sassy gay best friend who feels more comfortable with the girls than the boys. This is one of the reasons he sneaks into the girls’ assembly with his masterful disguise of a blue hoodie and sunglasses. Make sure to tell people throughout the night that “she doesn’t even go here,” for maximum costume effect. 6-7 If you have been around any group of young people lately, you have probably heard the term 6-7. These same youths will not be able to tell you exactly what that even is, but rest assured they are obsessed with it. A quick Google search will tell you it came from rapper Skrilla’s song “Doot Doot,” but then turned into a TikTok sensation and took on a life of its own. You can be a hit at the costume party with the young people and thoroughly confuse everyone else by wearing a t-shirt with the two numbers. You could even turn this into a couple’s costume and both wear just one number. View the full article

-
If you're getting more scam texts than your friends and family, it turns out it might be your mobile platform, at least going by a recent poll from Google and YouGov. According to Google, users on Android report receiving 58% fewer scam texts than those on iOS, and that number is even better on Pixel devices. Credit: Google That data comes from a survey Google and YouGov conducted of over 5,000 Android and iOS users across the U.S., India, and Brazil. The data says that Android users as a whole were "58% more likely than iOS users" to report that they had not received any scam texts in the week prior to the survey, and that iOS users were 65% more likely than Android users to report getting three or more scam texts in a week. On the whole, it also says that Android users were 20% more likely to describe their device's scam protection features as "very effective" or "extremely effective." As for Pixel vs. iPhone specifically, the survey also found that Pixel users were 96% more likely to report zero scam texts than iPhone users, and that iPhone users were 136% more likely to say they had received "a heavy volume of scam messages" than Pixel users, as well as 150% more likely to say their device was "not effective at all in stopping mobile fraud." Those numbers don't look good for Apple, although it's worth pointing out a few details before taking Google at its word. What is YouGov?First, to Google's credit, it didn't conduct this study alone. While the company didn't go into detail on how it partnered with YouGov here, YouGov itself is a respectable entity, widely cited in market research and even political news. The organization specializes in polls, and has been cited in everything from the New York Times to Lifehacker sister publication Mashable. It's also worth pointing out that YouGov wasn't the only independent entity Google worked with while putting together its report. The company also reached out to Counterpoint Research to evaluate its AI-powered anti-scam protections, and Leviathan Security Group to asses scam protection across four Android phones. The company used these studies to put together infographics depicting its security features vs. iPhone's, which you can see below. Credit: Google Credit: Google Note, however, how Google has put together the information here. Specifically, it implies that iPhone does not offer any scam protections in emails, while ignoring that many iPhone users access their email through the same Gmail app as on Android. It also doesn't mention Safari's ability to block pop-ups or the iPhone's ability to screen phone calls, which makes me think Google might be getting choosy with how its presenting the data here. As such, it's worth looking at its survey results with a critical eye as well. Questions about methodologyWhile Google's survey results are likely accurate to the polled audience, I do have a few questions about the methodology. First, there's the issue with this being a survey, rather than a more dispassionate look at texting inboxes. While helpful for getting insight into how users perceive their devices, surveys are susceptible to the word of those surveyed, which means that can be swayed by respondents misremembering details or misunderstanding questions. The bigger question to me, though, is sample size. While I commend Google for conducting its survey across three different regions, the company was not clear about how many of its respondents owned iPhones vs. Android devices. It's possible that iPhone users might have reported more scams simply because the iPhone is more popular in the U.S., for instance. To be fair, those numbers are reversed in India and Brazil, but without knowing a breakdown of how many people Google and YouGov interviewed where, it's hard to know if the data is being impacted by other factors. For instance, in addition to potentially being more numerous depending on a breakdown of the surveyed population, iPhone users might also be more susceptible to scam texts simply because scammers might want to target that user base more, as was once the case with viruses on Windows. The iPhone is known as a luxury device, which implies its user base might have extra money to spend, making it an alluring target. Can you believe Google's survey?So, can you take Google's polling at its word? Yes and no. With YouGov helping the company out, it's likely that the results presented are truthful, although they could still be misleading. The only way to know for sure would be to look at a detailed breakdown of the survey itself, but unlike the Counterpoint Research and Leviathan Security Group evaluations, there doesn't seem to be a way to look at the raw survey data at the moment, just Google's blog reporting on its findings. I've reached out to Google and YouGov independently with questions about their methodology, and did not immediately hear back. For good measure, I've also reached out to Apple for its take, and similarly am still waiting for a reply. In the meantime, I would take this survey with a grain of salt. It's almost certainly based in truth, but it's important to remember that it's still part of a larger advertising narrative. Google has made a big deal as of late about calling Apple's ecosystem a walled garden. If the company can convince users that it can offer them greater freedom while also upping their protection, that would be a big win. It does, however, coincide with Android's own efforts to close itself off in the name of security, so maybe the truth is both platforms aren't so different after all. View the full article
-
Beijing shows it can force Washington to compromise on trade issues View the full article
-
The market for obesity and diabetes treatments remains scorching hot, funneling billions in sales to Eli Lilly and fueling a bidding war over another drugmaker. Lilly said Thursday that its top-selling drugs, Mounjaro and Zepbound, brought in more than $10 billion combined during the recently completed third quarter. That made up over half of the drugmaker’s $17.6 billion in total sales. Separately, Danish drugmaker Novo Nordisk announced plans to buy Metsera Inc. in a deal that could be worth up to $9 billion. That came more than a month after U.S. drugmaker Pfizer Inc. made a nearly $5 billion bid for Metsera, which has no drugs on the market but is developing several potential oral and injectable treatments. Popular treatments labeled GLP-1 receptor agonists are fueling the soaring sales and deal interest. They work by mimicking hormones in the gut and the brain to regulate appetite and feelings of fullness. But they don’t work for everyone and can produce side effects that include nausea and stomach pain. Supplies of the drugs have improved this year, and some insurance coverage is growing. That helps improve access to drugs that can cost around $500 a month without coverage. That can put them out of reach for many patients. The treatments are injectable drugs, but Novo and Lilly also are developing easier-to-take pill versions. U.S. sales of Lilly’s weight-loss treatment Zepbound nearly tripled to $3.57 billion in the third quarter. Meanwhile, revenue from the diabetes drug Mounjaro, which has been on the market longer, doubled to $6.52 billion thanks to growth outside the U.S. Combined, the drugs have brought in nearly $25 billion in sales so far this year for Indianapolis-based Lilly. That surpasses the entire company’s revenue total from 2020. The drugs helped Eli Lilly and Co. record a $5.58 billion profit in the third quarter and deliver a better performance than Wall Street expected. Novo Nordisk said it will pay $56.50 in cash for each Metsera share and could pay an extra $21.25 if the company meets some drug development milestones. The drugmaker already has the obesity and diabetes treatments Wegovy and Ozempic on the market. That combined total of $77.75 more than doubles the closing price of Metsera shares on Sept. 19, the last trading day before Pfizer made its offer. Metsera said Thursday that its board has determined that the new, unsolicited offer from Novo was superior, and Pfizer has four business days to negotiate adjustments to its offer. Pfizer called Novo’s offer “reckless and unprecedented” and an attempt by a drugmaker with a “dominant market position to suppress competition in violation of law by taking over an emerging American challenger.” Pfizer Inc. is known for the COVID-19 vaccine Comirnaty and the treatment Paxlovid, among other drugs. But the New York drugmaker decided to take another stab at obesity treatments months after ending development of its own drug. —Tom Murphy, AP health writer AP Health Writer JoNel Aleccia contributed to this report. View the full article

-
I am extremely concerned about the prevalence of AI content on our social media feeds. Now that just about anyone can generate hyper-realistic videos with a simple text prompt, I fear that disinformation will rise exponentially, distorting worldviews faster than algorithms have so far been able to do. So you can imagine how I feel about Meta's plans to add a "huge corpus" of AI content to its feeds. Good luck out there, everyone. That's directly from Meta CEO Mark Zuckerberg himself. In a Meta Platforms, Inc. earnings call on Wednesday, Zuckerberg confirmed the company's plans to add this self-described huge corpus of content, thanks to how easy AI makes it to create and "remix" content. People will create AI content, the platform's recommendation systems will deliver that content to people, who may then slightly alter that content and send it back into the Metaverse. As this feedback loop will continue, feeds will start filling up with more and more AI content. That's good for Meta, and anyone who enjoys watching videos that aren't real. For those of us a little sick of this content, or worried we won't be able to spot it during long scrolling session, it's only bad news. While much (if not most) of that AI content is likely coming from outside sources, like OpenAI's Sora, some of it may come from Meta itself. The company recently rolled out "Vibes," its own short-form AI video generator, as part of the existing Meta AI app. Users can create videos directly in Vibes, or remix existing videos. I'd wager some Vibes content is going to cross your Meta feed in the near future, if it hasn't already. Zuckerberg took the time to highlight how Meta's AI recommendation systems across all of its core products—Facebook, Instagram, and Threads—are delivering "higher quality and more relevant content" to users, especially with regards to video. Apparently, the amount of time we've spent watching Instagram reels has increased by more than 30% when compared to last year. (Fun fact: Reels brings in over $50 billion according to the earnings call.) That environment seems just right to foster a new wave of AI slop to Meta's enormous audience. Look, I've definitely laughed at some AI memes that have come my way. But to suggest that flooding the feeds with realistic AI videos without any regulation or forethought is a good idea is itself laughable. If you use Meta products, watch out: You might not be able to trust what you're watching is actually real for much longer—if at all. View the full article
-
Uncover how high-speed internet access drives property valuations, creates lending opportunities, and transforms mortgage markets nationwide. View the full article

-
Proposal highlights The President administration’s push to deregulate financial industryView the full article
-
Shares jump after ecommerce giant says web services division is growing at fastest pace in three yearsView the full article
-
Royal subject to ‘censures deemed necessary’ in sharp change of tone by Buckingham PalaceView the full article
-
Tech giant reports record annual profits as smartphone sales and services income pick upView the full article
-
I’ve been using Fitbit’s revamped app, currently in “public preview” mode for adult Android users in the United States. While I like the simplified aesthetic, its functionality seems to center around the questionable AI that gave me so many wrong and confusing answers. Let me take you on a tour of where the new app has improved, where it’s falling short, and what’s still missing. Better: cardio load and key metrics are easy to readThe top few metrics on the home screen have always been configurable, but I find the new version is even more readable than the old one. You get three “focus metrics” on the right hand side, and a big donut shape giving your progress toward your cardio load. Fitbit's current app is on the left; the updated preview version is on the right. Credit: Beth Skwarecki/Fitbit Measuring cardio load as progress toward a weekly goal is a welcome change; previously, cardio load was a daily measure that often didn’t correspond to reality. There’s a downside to the new view, though: in the old version of the app, you could turn off the recommendations or hide them. In this version, there’s no way I could find to remove that metric from the top of your screen. Better: separate tabs for fitness, sleep, and health What you see on the Fitness, Sleep, and Health tabs. Credit: Beth Skwarecki/Fitbit Finding any specific data in the old Fitbit app always meant scrolling through a CVS receipt-length list of things you weren’t looking for. Items tended to be grouped, which helped a little, but ultimately some things need more space than the little card they were stuffed into. You couldn’t find your recent workouts without guessing on which tile to tap—turns out it’s Exercise Days (but not Cardio Load or Active Zone Minutes). But now, you just tap on the Fitness icon at the bottom, and there everything is! My exercise days and weekly cardio are there, then a listing of upcoming workouts, and then my recent activities. I can log a manual activity right from this screen. Perfect. (The button doesn’t seem to be working right now, but hey, it’s a beta. I can appreciate the idea.) Same goes for the Sleep tab. Right up top there’s a trend insight (“Your steps linked [sic] to better sleep quality”) and then I get my graph of sleep stages, and a list of “key metrics” like when I went to bed and how much time in bed was spent awake. The Health tab gives my vitals, like my resting heart rate and HRV. If I scroll down, I can set up alerts, update my profile, and the “coach notes” that the AI has written down about me. For example, I see “wants low reps and heavy weights” and “hates lunges.” Worse: glitches galoreI know it’s a beta, but things seem really rough. My workout from two days ago is listed as “upcoming,” and the app crashes when I try to mark it as completed. The old Fitbit app says that my high and low heart rate notifications are “on & checking” but the new app says I still need to set them up. Some of the AI conversations fail to load at all. When they do, often the bot tells me it doesn’t have access to the information I’m asking about, or it says that “internally” it sees something different than what I’m seeing in the main screens of the app. The team has a lot to fix before these features are ready for widespread use. Worse: structured data views are replaced with AI conversationsHumans invented graphs, charts, and other means of data presentation because these are easy to scan and interpret at a glance. The new Fitbit app can generate some charts (great!) but tends to present these as little cards to illustrate insights from the AI bot. To see more data, you’d think you could tap on a button or card about a recent run to get your lap times, running dynamics, and other information. But that doesn’t seem to be an option. Instead, I get a “continue conversation” button that seems to want to feed a screenshot of the AI output back into the AI bot. I’ve already written about some of the problems I’ve had conversing with the AI bot, so I won’t rehash those issues here. (It hallucinates in ways that are sometimes hilarious and often frustrating.) But even if the AI was as intelligent as it’s supposed to be, this would still be a major issue. The AI responses are slow, and I can’t always get the bot to give a straight answer to my questions. In short, it seems like the app’s designers said “we’ll have the AI handle it” anytime they weren’t sure how to build a feature. So the app feels like a mere wrapper around the bot, and the bot is just not the right tool for all those jobs. Missing: nutrition, menstrual health, and moreGoogle says that it hasn’t ported all the Fitbit app’s features to the new preview. When I asked about these limitations by email, the response I got was that “As a preview, the service is not yet feature-complete and lacks several functionalities to focus testing on the core AI coaching experience.” A full list of missing features is available from this Fitbit forum post. They include: Nutrition tracking Hydration tracking Menstrual health Community features Badges Social media sharing Heart rate zone analysis for workouts Running analytics for Pixel Watch 3 and 4 users (other devices don’t provide this data) Syncing data from Aria Air smart scales The post also notes that the AI coach treats certain subjects as off-limits for the moment, including those related to weight, body fat, running distance, and heart health measurements like ECG and irregular rhythm notifications. View the full article
-
The tech giant provided context around Flagstar and Pennymac's moves, as it reported more Encompass and MSP clients and greater mortgage income. View the full article

-
We may earn a commission from links on this page. Deal pricing and availability subject to change after time of publication. The Tinymoose Pencil Pro Ultra is both an affordable accessory and a serious productivity tool, and it's currently on sale for $39.95 on StackSocial. It costs less than a third of what Apple charges for its stylus, and it works with an Android device thanks to its Smart Switch button on the top. A single press lets you jump from sketching on an iPad Pro to jotting notes on a Galaxy Tab without digging through settings. That makes it more flexible than most one-platform pens, especially for students or professionals who don’t want to carry two separate styluses. It also works on phones in dual mode, which could be handy if you like editing photos on your Android but use your iPad for work. In use, the Pencil Pro Ultra does a lot right. Tilt sensitivity and palm rejection give you smooth shading and writing, at least on supported tablets, while zero-lag precision keeps lines from wobbling behind your strokes. Bluetooth gestures add a layer of convenience: one press takes you home, two pulls up multitasking, and a long press powers it on or off. As for the battery life, it holds its own with 10 hours of productivity, and supports fast charging via USB-C. There are trade-offs, though. Palm rejection and tilt features only work in tablet mode, which means the experience is more basic when you’re on a phone. The magnetic attachment also doesn’t work outside of Apple’s tablets, so Android users will need to keep the included leather case handy. And while it’s backed by a six-month warranty, that’s shorter than what you get from bigger brands. Still, with three extra nibs, a carrying case, and cross-platform support baked in, it’s a compelling option for anyone who doesn’t want to lock into one ecosystem. If you’re a casual creator, note-taker, or multitasker who wants a stylus without splurging, this deal is worth considering. View the full article
-
Two prominent Republicans on Capitol Hill want the Supreme Court to allow a lawsuit to proceed against tech giant Cisco over allegations that the company’s technology was used to persecute members of the Falun Gong religious sect in China. In a Wednesday letter to the The President administration’s top Supreme Court litigator, D. John Sauer, Reps. Chris Smith of New Jersey and John Moolenaar of Michigan urged the administration to side with the Falun Gong plaintiffs and press the court to allow the lawsuit to go to trial. Smith co-chairs the Congressional-Executive Commission on China, while Moolenaar is the chairman of a special China committee set up in the House of Representatives — and both are prominent critics of Beijing’s human rights record. The letter cited an AP investigation last month that showed American tech companies to a large degree designed and built China’s surveillance state, saying it “underscore(s) the need to deter American firms from supplying technology to facilitate the CCP’s human rights abuses.” The decision ultimately rests with the Supreme Court whether to hear the challenge brought by Cisco arguing that U.S. law does not permit such a suit. But as part of considering the case the court sought the views of the solicitor general, who represents the U.S. government’s position in oral arguments and proceedings. The The President administration’s view on the case will also be of interest to the court because Cisco has argued that the case involves U.S. foreign relations and should be dismissed on those grounds. The solicitor general is expected to file a brief later this year or early next year. “The allegation that an American tech company custom-designed a tool to facilitate the violent persecution of a religious minority by the Chinese Communist Party (CCP) is a serious one,” the two lawmakers wrote in a letter to Sauer. “We believe the Plaintiffs deserve the chance to prove their claims.” “We have a longstanding commitment to uphold and respect human rights for all people and if the 2023 ruling of the Ninth Circuit Court stands, it opens the floodgates for suits against U.S. corporations merely for legal exports of off-the-shelf goods and services,” said a spokesperson for Cisco. The case has a long and winding history dating back more than a decade. In 2008, documents leaked to the press showed Cisco saw the “Golden Shield” as a sales opportunity, quoting a Chinese official calling the Falun Gong an “evil cult.” A Cisco presentation reviewed by AP from the same year said its products could identify over 90% of Falun Gong material on the web. Other presentations reviewed by AP show that Cisco represented Falun Gong material as a “threat” and built out a national information system to track Falun Gong believers. In 2011, Falun Gong members sued Cisco, alleging the company tailored technology for Beijing that they knew would be used to track, detain and torture believers. The issue before the Supreme Court is whether an American company can be held liable under two separate laws for aiding and abetting human rights violations. Cisco argues it isn’t liable under those laws, the Alien Tort Statute (ATS) or the Torture Victim Protection Act (TVPA), but a federal appeals court rejected the company’s arguments in 2023, allowing the case to continue. Now Cisco is asking the Supreme Court to throw out that ruling and stop the lawsuit. In recent years, the Supreme Court and presidential administrations of both parties have been skeptical of lawsuits seeking to use U.S. courts as a venue to seek justice over the acts of foreign governments, especially those that took place abroad. In the case of Cisco, the Falun Gong members have argued that a substantial portion of Cisco’s activities involving China took place in the United States. An AP investigation this week found that the U.S. government across five Republican and Democratic administrations repeatedly allowed and even actively helped American firms to sell technology to Chinese police and surveillance companies, even as activists warned such tools were being used to quash dissent, persecute religious sects and target minorities. Going into the long-heralded meeting Thursday between leaders Donald The President and Xi Jinping, the sale of U.S. technology to China has been among the thorniest issues the U.S. faces, with billions of dollars and the future of tech dominance at stake. The President said after the meeting that China will speak with Silicon Valley chipmaker Nvidia about purchasing their computer chips. Debate over the sale of technology to China has grown heated, with some arguing for a harder stance. American companies have pushed back against restrictions, arguing it will push China to develop its own domestic supply and strengthen its position in the global race for leadership in artificial intelligence. But many national security experts say selling such technology could assist China’s military and intelligence services. The plaintiffs’ lawyers make a similar case, citing Cisco marketing materials in China that promoted routers for use in tanks. If the Cisco suit is successful, it would signal that American companies can be held liable in some circumstances for abuse of their technologies overseas. —Dake Kang and Byron Tau, Associated Press AP writer Mark Sherman contributed to this report from Washington. View the full article

-
Stablecoins might not send your digital wallet to the moon, but the less speculative side of cryptocurrency is definitely enjoying its moment in the sun. According to a new report from Fortune, credit card stalwart Mastercard wants to make a massive bet on infrastructure that links digital currencies to the normal financial world. Mastercard is in advanced talks to buy the stablecoin startup Zerohash for between $1.5 and $2 billion, Fortune reports. Zerohash, founded in 2017, provides banking companies a toolkit for providing their own cryptocurrency and stablecoin products. If the deal goes through, it would represent a major investment in cryptocurrency infrastructure from a traditional banking company. When reached by Fast Company, Mastercard and Zerohash declined to comment. The report comes weeks after Mastercard was reportedly competing to buy BVNK, a startup that helps businesses integrate transactions using stablecoins, which are digital currencies pegged to the value of traditional currencies. According to the same report by Fortune, Coinbase made it further in those acquisition talks, hence Mastercard turning to Zerohash for a parallel deal. BVNK didn’t immediately respond to Fast Company’s request for comment. Crypto’s unsexy side Stablecoins serve as a bridge between the volatile world of cryptocurrencies, where massive price swings are the norm, and stable national currencies like the U.S. dollar. Because they aren’t really used for speculation or investment, stablecoins provide many of the perks promised by the crypto revolution like instant transactions and a digital ledger without the downside of assets that tend to spike and plunge. The less flashy side of crypto has come into the spotlight lately. Circle’s flashy IPO in June saw the stablecoin company’s share price almost triple overnight. Earlier this year, fintech giant Stripe bought the crypto payments platform Bridge, paying $1.1 billion to build out its own stablecoin infrastructure. Chase also recently announced its own stablecoin play, connecting its credit card rewards program with the stablecoin USDC through Coinbase. Mastercard has signaled its interest in crypto, and specifically stablecoins, previously. Over the summer, it joined the Global Dollar Network, a consortium of companies boosting stablecoin adoption, alongside Robinhood and other companies from the crypto side of things. In 2021, Mastercard acquired the crypto analytics company CipherTrace, though it later shuttered most of the products it obtained through the deal. Traditional financial giants aren’t the only ones getting in on the stablecoin frenzy. Walmart and Amazon are both exploring the possibility of issuing or otherwise leaning on stablecoins, according to a report from The Wall Street Journal. Enabling payments through stable cryptocurrencies could allow retail giants to duck the billions they pay in transaction fees – an existential threat to banks and credit card companies that make a sliver of every sale. Era of deregulation The explosion of stablecoin deals and soaring crypto values aren’t happening in a vacuum. The President’s second term has ushered in an era of dramatic deregulation in the U.S., and buzzy crypto startups and normie finance giants alike are racing to cash in. The president himself is pouring gasoline on the crypto wildfire, as his media company bets big on Bitcoin and his policies boost the The President family’s latest crypto venture – strokes of self dealing that would have been a historic scandal in any other presidency. If 2025’s spate of deals connecting the traditional finance world and stablecoin startups pans out, the least sexy side of cryptocurrency might have the most staying power – and an actual everyday use case beyond sending your bank account to the moon. View the full article
-
Mark Walter is the majority owner of the Los Angeles Lakers after the NBA Board of Governors approved his purchase of a controlling stake from the Buss family. The Lakers and the league confirmed the next step Thursday in a transaction that is expected to close shortly. The sale of the NBA’s most valuable franchise was initially announced in June. Jeanie Buss will remain the Lakers’ governor under the deal for at least the next five years, and she will oversee day-to-day operations “for the foreseeable future,” the team said. Her father, Jerry Buss, bought the Lakers in 1979. But the Lakers are now primarily owned by Walter, the billionaire whose TWG Global investment group owns the Los Angeles Dodgers and the WNBA’s Los Angeles Sparks. The group is also the majority owner of the new Cadillac Formula 1 team, which begins competition next year. The Lakers sale was completed with a franchise valuation of $10 billion, the highest ever set for a pro sports team. “The Los Angeles Lakers are one of the most iconic franchises in all of sports, defined by a history of excellence and the relentless pursuit of greatness,” Walter said in a statement. “Few teams carry the legacy and global influence of the Lakers, and it’s a privilege to work alongside Jeanie Buss as we maintain that excellence and set the standard for success in this new era, both on and off the court.” The Lakers have won 17 NBA championships and built a worldwide fan base through decades of consistent winning with many of the most famous players in basketball history, from George Mikan to LeBron James. Jerry Buss bought the Lakers, the NHL’s Los Angeles Kings and the Forum arena from Jack Kent Cooke for $67.5 million. “Over the past decade, I have come to know Mark well — first as a businessman, then as a friend, and now as a colleague,” Jeanie Buss said. “He has demonstrated time and time again his commitment to bringing championships to Los Angeles, and on behalf of Lakers fans everywhere, I am beyond excited about what our future has in store.” —Greg Beacham, AP sports writer View the full article

-
Here's a question you've probably never considered before: Would you buy a new iPhone if it didn't have any physical buttons? Sure, the part of the phone you interact with most is the touchscreen, so maybe it doesn't seem like such a big deal. But think about it: The side button, volume buttons, Action button, and Camera Control button would no longer click. Could you live without the clutter? While Apple sells no such iPhone, and likely won't release one next year, it very well might roll out a buttonless iPhone in 2027—at least, physically buttonless. That year will mark the 20th anniversary of the iPhone, and it'll come as no surprise that rumors suggest Apple is planning something special for the "iPhone 20." And that something might include ditching all the mechanical buttons and replacing them with haptics. A truly buttonless iPhoneIf you owned an iPhone 7 or iPhone 8, you'll understand the idea here. Those iPhones replaced the mechanical Home button with a solid state haptic button. Essentially, Apple used clever haptic vibrations to create the illusion of a button press, but, in fact, the "button" doesn't move at all. You'll realize this if the phone is completely off: The once pressable Home button doesn't actually do anything. It's the same case with any MacBook released over the past decade: Your trackpad isn't actually a button, so when the computer is off, the glass doesn't move. The suggestion that the iPhone 20 will replace all of its buttons with this type of tech comes from leaker Instant Digital, who has previously claimed Apple intend to build a button-free iPhone. In the past, Instant Digital only confirmed vague plans by Apple to create such a phone sometime in the future, but this week, the leaker was more definitive: In a post on Weibo, Instant Digital asserted that Apple has "completed functional verification" for these haptic buttons, and is planning for "mass production and application" with the iPhone 20. All of the buttons, from the Side button to the Camera Control buttons, would adopt this technology. Interestingly, Instant Digital claims Apple will bridge the gap by simplifying the structure of the Camera Control button in next year's iPhone 18. Apple might remove the capacitive sensing layer of the button and keep just the pressure sensitivity. We'll have to see whether other rumors confirm this. Would you buy a buttonless iPhone 20?The iPhone 20 unveil is nearly two years away, and all rumors should be taken with a grain of salt. Apple might have big plans in store for this iPhone, but haptic buttons might not have anything to do with them. But let's assume for the sake of argument that Apple does exactly what Instant Digital suggests. Would you buy it? This would be a fundamentally different experience from any other iPhone, or really, any other smartphone. Even if you once had an iPhone with a haptic Home button, you've always had physical buttons to control the volume, to call up Siri, or to shut down your device. Those experiences would feel different, and could be more difficult to use just by feel alone, unless Apple makes each "button" physically obvious. It also calls into question how one would perform any hardware tasks that currently require physical buttons. Once Apple removed the physical Home button, you couldn't use it to reset the iPhone, so Apple gave the volume button that job instead. But if all buttons aren't really buttons anymore, how would you reset the iPhone if the screen becomes unresponsive? Plug it into a computer? Take it to an Apple Store? Say a prayer? My guess is Apple will have a solution, but at the moment, it's not clear what it would be. Personally, I don't think the change would influence my buying decision one way or the other. I'm hopelessly stuck in Apple's ecosystem, so I'll likely upgrade whenever my current iPhone bites the dust. If my options at that point include an iPhone without buttons, so be it, but I wonder if other iPhone users feel the same. (Plenty of you are still mourning the loss of the headphone jack.) View the full article
-
Smartsheet is software that has built its entire platform on the familiar landscape of spreadsheets. While it does more than a traditional Excel spreadsheet, does it have the features that project managers and their teams need to track work and stay on schedule and budget? Of course, we’re referring to a Smartsheet dashboard. To find out if there is a Smartsheet dashboard and, if so, how powerful it is, we’re going to test drive the software. We’ll determine the value of its tracking features and review the pros and cons to make sure that potential users looking for dynamic project management software are steered in the right direction. What Is Smartsheet? Smartsheet is a cloud-based work management platform designed to help teams plan, track and execute projects of all sizes. It combines the familiar look of a spreadsheet with project management features, making it easy for users to collaborate, automate workflows and share real-time updates. The platform is used across industries for tasks ranging from simple to-do lists to complex portfolio management. Smartsheet supports a wide range of project management needs by offering multiple views, including grid, Gantt chart, card and calendar. This flexibility allows teams to choose the best way to visualize and organize their work. The platform also integrates with popular apps like Microsoft Teams, Google Workspace, and Salesforce, allowing information to flow easily between systems. That leads us to ask if there is a Smartsheet dashboard? Dashboards are essential visual tools that provide a high-level overview of the project’s key metrics, such as time, cost, resources and more. Dashboards help project managers, teams and enable stakeholders to track progress, monitor KPIs and make data-driven decisions without sifting through multiple documents or emails. Does Smartsheet Have a Dashboard? A Smartsheet dashboard would be a deal breaker for any project management team looking for a software solution that can help it plan, manage and track its work. This tool is part of any thoroughly designed project management software product. Of course, just having a dashboard is often not enough. Many tools have them, but they’re lacking in features. If there is a Smartsheet dashboard, great, but we’re going to take it for a spin and see if it delivers on the promise of making it easy for project managers to monitor their projects. We’ll get into the specifics of what the features are that lift a regular dashboard into a must-have project management tool. But first, let’s get to answering our initial question. Short Answer: Yes, Smartsheet Has a Dashboard The Smartsheet dashboard is part of the work management software, but everything must be customized, which takes away valuable time from the actual management of the project. That means the dashboard must be manually configured, taking a lot of time. This wouldn’t be such a problem except for the fact that some competitors have a dashboard that automatically collects live data without any lengthy setup process. /wp-content/uploads/2025/08/Smartsheet_Dashboard-Financial.webp Long Answer: Smartsheet Dashboards Lack Key Features for Project Management The Smartsheet dashboard can feel limited compared to more advanced business intelligence tools. Building complex visualizations often requires manual setup and linking to multiple sheets, which can become time-consuming, as we’ve said. These and other drawbacks often lead users to look for a Smartsheet alternative. There are also customizable reports to share with stakeholders, multiple project views for different workloads, secure timesheets, version control, automated workflows with task approval settings and powerful resource management tools to keep teams productive. Get started with ProjectManager today for free. /wp-content/uploads/2024/04/Light-mode-portfolio-dashboard-CTA.pngLearn more Smartsheet Dashboard Features The Smartsheet dashboard provides a clear, real-time view of project data through customizable widgets that display live information from sheets and reports. It centralizes charts, reports, text, and images in one visual hub, making it easy to track performance, share updates, and keep stakeholders aligned across multiple workspaces and projects. Smartsheet dashboard is built from configurable widgets that display live data from sheets and reports. Widgets can be customized in layout, color, alignment and behavior. Chart widget supports multiple chart types including line, bar, stacked bar/column, pie, donut and scatter. Image widget allows the inclusion of logos, photos or other images. Web content widget embeds external content such as forms, videos, or dashboards from Power BI or Tableau. Dashboards can be shared with stakeholders, published as public links or embedded on other sites. Widgets show real-time data that updates automatically when the source sheet or report changes. Dashboards are viewable on the Smartsheet mobile app. Supports embedding and integration of third-party tools and content. What Project Management Features is Smartsheet Dashboard Missing? While the Smartsheet dashboard is visually powerful, it lacks deeper project management functionality. It doesn’t track planned versus actual performance, workload balance, or cost variance. These gaps make it better suited for surface-level visibility than detailed project monitoring or performance evaluation. Dashboards can’t compare planned vs. actual schedule or cost performance. No built-in tools for cost tracking. Workload and resource balancing visuals are unavailable. Dashboards don’t forecast completion dates or trends. Limited interactivity; no drill-down or live filtering. Portfolio-level rollups require manual setup or premium add-ons. KPI thresholds and color-coded alerts can’t be automated. Data refresh intervals can’t be adjusted. Conditional access and user-specific visibility are missing. Global filters across all widgets aren’t available. Export options are limited to printing or sharing links. Cumulative progress metrics over time require manual setup. How to Make a Smartsheet Dashboard Better With ProjectManager If you’re using a Smartsheet dashboard and feeling its limitations, there’s a workaround. You can turn that lacking tool into an advanced project and portfolio management dashboard by importing your project into ProjectManager. That not only improves your dashboard game but also gives you access to our robust suite of powerful project management tools. Start a free 30-day trial with ProjectManager, no credit card needed, to see the difference. Then follow these steps. /wp-content/uploads/2025/08/Smartsheet-PM-Import-Dashboard.png To do so, you can export the data from your Smartsheet project as a CSV file and then import that data into ProjectManager so you can enjoy a better project management experience and use a better project dashboard. Smartsheet Dashboard ProjectManager Dashboard Centralized dashboards built from configurable widgets Real-time dashboards with panels for cost, time, workload, and progress Supports multiple chart types (bar, line, pie, donut, scatter) Offers various visualizations, including time-based charts and performance gauges Widgets display live data from sheets, reports, and summaries Dashboards pull real-time data directly from projects, tasks, and portfolios Rich text, image, web content, and shortcut widgets supported Widgets include project metrics, cost tracking, workload, and risk indicators Dashboards can be shared or published as public links Dashboards can be shared with teams, clients, or executives via secure links Real-time updates reflect changes in source sheets Automatically syncs with live project data for real-time reporting No planned vs. actual schedule or cost variance tracking Tracks planned vs. actual performance, budget variance, and baseline comparisons No workload or resource balancing visuals Displays workload and resource utilization across multiple projects Portfolio-level dashboards require manual setup Built-in portfolio dashboards with real-time cross-project data Limited interactivity and no live drill-downs Interactive dashboards with drill-down functionality and filtering No formula-based or calculated metric widgets Supports calculated KPIs, formulas, and custom data metrics Limited layout customization for widgets Drag-and-drop widget customization and layout editing Export limited to printing or public links Export dashboards to PDF, Excel, or image formats No automation or KPI alert integration Includes real-time KPI tracking, alerts, and automated updates Data updated in real time Fully automated real-time synchronization across all dashboards 1. Export Your Smartsheet Project The first step is to export your project from Smartsheet into a compatible format. Smartsheet allows you to export data as an Excel file, which is the easiest way to move it into ProjectManager. Open your Smartsheet project, go to the file menu and choose the option to export as Excel. Save the file somewhere easily accessible. 2. Select the Excel File and Import It into ProjectManager In ProjectManager, go to the import section and select the option to upload an Excel file. Locate the file you exported from Smartsheet and select it. ProjectManager will recognize the spreadsheet and prepare the data for mapping into the new system. /wp-content/uploads/2022/10/Gantt-import-light-mode.png 3. Add the Data to a New or Existing Project You can decide whether you want to create a new project in ProjectManager using your imported data or merge it into an existing one. Creating a new project ensures all the imported tasks, deadlines and assignments are organized from scratch. Merging with an existing project can be useful if you’re combining multiple data sources. 4. Choose What Data to Import ProjectManager allows you to select which data fields you want to import from Smartsheet. You can include task names, deadlines, assignees, dependencies and more. This flexibility helps ensure you only import the most relevant information and keep your new project file streamlined. 5. Success! View Smartsheet Dashboard Data in ProjectManager Once the import process is complete, you’ll be able to see your former Smartsheet dashboard data inside ProjectManager. From here, you can take advantage of ProjectManager’s advanced features such as multiple project views, resource tracking and real-time dashboards to enhance visibility and improve project performance. Smartsheet Dashboard Pricing The dashboard feature in Smartsheet is included starting from the first paid tiers—there is no permanently free plan that offers full dashboard access. This means that teams relying on dashboards must be on a paid plan, which could be a barrier for very small teams or individuals. Free Plan: Smartsheet dashboard is not included in this pricing plan. Pro Plan ($9/user/month, billed annually): Smartsheet dashboard is included in this pricing plan but limited to a maximum of ten widgets per dashboard. Business Plan ($19/user/month, billed annually): Smartsheet dashboard is included in this pricing plan with higher widget limits, advanced sharing options, and more customization features. Enterprise Plan (custom pricing): Smartsheet dashboard is included in this plan with full platform functionality, unlimited widgets, enhanced governance, and enterprise-level controls. What Can You Use a Smartsheet Dashboard For? The Smartsheet dashboard provides a convenient way to view project data at a glance. It brings together charts, reports and metrics from different sheets to create a clear visual snapshot of current progress. For quick status checks or high-level updates, it’s a useful feature that helps teams stay informed without having to navigate multiple files. However, that’s about as far as its capabilities go. The Smartsheet dashboard doesn’t offer advanced project monitoring functions such as comparing planned versus actual performance, assessing cost or schedule variance, or tracking team productivity. It can’t be used to balance workloads or forecast project outcomes either. The data it presents is static, giving only a surface-level picture rather than deep performance insights. While it looks professional and simplifies reporting, the Smartsheet dashboard ultimately lacks the analytical depth required for real project monitoring and performance evaluation. Smartsheet Dashboard Example Let’s prove our point by showing exactly how limited this software is by illustrating with a Smartsheet dashboard example. Below is a screenshot of what one looks like, and on first glance, it’s clear how limited it is. /wp-content/uploads/2025/08/Smartsheet-Dashboard-Project-Management.png There is some useful project information, such as the start date, end date, duration and a percentage complete status. But in terms of key metrics, this dashboard is light on specifics. There’s one bar chart and some links, but it’s not much help as an overview of the project’s progress, performance and resources. Cons of Making a Smartsheet Dashboard There are more reasons to stay away from this software. One of the main drawbacks of creating a Smartsheet dashboard is the amount of manual setup required. We said it before, but it’s such a major flaw that it must be restated. While the tool offers flexibility, each widget often needs to be connected to specific sheets or reports. This can become tedious when managing multiple data sources. If the underlying sheets are not well organized or consistently maintained, the dashboard can quickly become inaccurate or outdated. Another limitation is the lack of advanced analytics features. Smartsheet dashboards are primarily designed for high-level visualization rather than in-depth data exploration. They can show charts and metrics, but they don’t offer the same level of interactivity or drill-down capabilities that more specialized analytics tools provide. This can be a challenge for teams that need deeper insights without exporting data to another platform. Performance can also be a concern for larger or more complex projects. Dashboards that pull from multiple sheets or large datasets may experience slow load times or delayed updates. In fast-paced environments where decisions rely on the most current information, this lag can be frustrating. Additionally, because dashboards are tied to the Smartsheet ecosystem, they may not integrate as seamlessly with external tools without extra configuration or third-party add-ons. No support for baselines or variance tracking: A Smartsheet dashboard cannot store or display a locked baseline schedule or budget for direct comparison with current performance data. This means you can’t visually track how far ahead or behind you are on key dates or spending in real time through the dashboard. Any variance analysis would need to be done in a sheet or report first, then summarized manually for the dashboard. No built-in resource or workload management visualizations: A Smartsheet dashboard lacks native widgets that dynamically display workload distribution or resource availability. This means you can’t see in real time who is overloaded or underutilized from the dashboard itself; such resource balancing views must be created in sheets or with external tools, then embedded as static or limited-refresh visuals. Limited linkage between dashboard metrics and reports: While you can tie dashboard metrics to cells in sheets, you can’t directly connect most widgets to complex reports or multi-sheet datasets. This restricts your ability to pull live cross-sheet aggregations into the dashboard without first building a summary sheet as an intermediary. No true portfolio-level rollup views: A Smartsheet dashboard cannot automatically roll up live data from multiple projects into a unified, portfolio-level summary without complex and expensive workarounds. While you can manually build summary reports or sheets to feed a dashboard, this functionality is not as seamless as other platforms. Some data requires manual updates to remain accurate: Depending on how your dashboard is set up, certain data widgets may not update automatically or can lag behind recent changes in the source sheets. This means extra manual refresh steps are needed to ensure viewers see the latest numbers. ProjectManager Has a Better Dashboard Than Smartsheet ProjectManager offers a more dynamic and adaptable dashboard than a Smartsheet dashboard, giving project managers real-time control over performance and progress. While Smartsheet dashboards can feel limited and require manual updates for accurate data, ProjectManager automatically refreshes as work is completed. This ensures teams always have up-to-the-minute visibility into their projects. With multiple viewing options, customizable widgets and powerful integrations, ProjectManager’s dashboard turns raw data into actionable insights that drive better decisions. Access real-time data without manual refreshes: Smartsheet dashboards often require you to refresh or reconfigure data sources before you see the latest project updates. In ProjectManager, the dashboard automatically updates as team members log progress, complete tasks or adjust timelines. This means you can walk into a stakeholder meeting confident that the data you’re presenting is current. Real-time visibility reduces the risk of making decisions based on outdated information. Customize dashboards to match your workflow: Smartsheet dashboards offer customization, but ProjectManager takes it further with a variety of widget types, drag-and-drop arrangement and personalized views for different team roles. Set up a dashboard for executives that focuses on high-level KPIs while creating another for your team that shows task progress and deadlines. This flexibility ensures each audience sees exactly what they need, improving communication without cluttering the display. Visualize progress with multiple project views: In Smartsheet, you’re largely tied to grid-like layouts unless you build complex configurations. ProjectManager allows you to jump seamlessly between Gantt charts, kanban boards and calendar views while keeping the dashboard synced in real time. This means you can monitor progress in the visual format that best suits the situation without losing sight of your overall goals. These multiple views help you spot bottlenecks early and maintain a clearer understanding of your project’s status. Track resources alongside project metrics: Smartsheet dashboards focus heavily on task status but often require extra work to track resources effectively. ProjectManager integrates resource management directly into the dashboard so you can see workload distribution, team availability and task assignments at a glance. This connection between project performance and resource use helps managers prevent burnout and balance workloads. How to Make a Dashboard in Smartsheet If, for whatever reason, readers are still interested in making a Smartsheet dashboard, follow these directions. Start by creating a new dashboard from the home screen. Name it and open the dashboard editor, where you can add widgets like charts, reports, text blocks or images. These widgets pull data from your existing Smartsheet sheets and reports, so you’ll need to have those prepared in advance. Each widget can be resized and positioned to create a layout that fits your needs. Once the structure is in place, link each widget to its data source by selecting the sheet or report and choosing the fields you want to display. You can then customize colors, labels and formatting to match your branding or project style. After saving, your dashboard can be shared with stakeholders or team members for real-time viewing. Keep in mind that the data refresh rate depends on how your sheets are updated, which may affect the accuracy of what’s displayed. Why ProjectManager Is Better Project Tracking Software Than Smartsheet While Smartsheet offers some project tracking features, it can be limited in flexibility, visibility and real-time control. ProjectManager provides a more dynamic and integrated solution that allows teams to plan, execute and monitor every aspect of their projects with precision. From versatile project views to advanced resource tracking, ProjectManager gives managers and teams the tools they need to keep projects on schedule and within budget while adapting quickly to changes. Learn more about ProjectManager’s powerful project and portfolio dashboards by watching the short video below. Plan, Schedule and Track With Multiple Project Management Views ProjectManager offers multiple views, including Gantt charts, kanban boards, task lists and calendar views. This flexibility means teams can choose the format that works best for their workflow while still sharing the same live project data. Managers can plan tasks, set dependencies and milestones and track progress in real time. The ability to switch views without losing context helps ensure all team members stay aligned and informed throughout the project lifecycle. /wp-content/uploads/2022/06/Construction-overlay-List-Light-task.jpg Track Costs With Online Timesheets, Workload Charts and Reports ProjectManager’s built-in timesheets allow for precise tracking of labor costs and billable hours, while workload charts visually show team capacity to prevent burnout. Detailed reports break down project performance by cost, time and resources, making it easier to spot risks before they impact delivery. A team page provides a daily or weekly overview, which can be filtered and tasks updated without leaving the page. These tools work together to give managers complete visibility into budget and resource health, something that can be more cumbersome to achieve with Smartsheet’s dashboard limitations. /wp-content/uploads/2023/01/Team-Light-2554x1372-1.png Related Smartsheet Content Still curious about Smartsheet? There are other articles you can read, which are linked below. They provide an overview, show various Smartsheet alternatives and compare the software to ProjectManager. What Is Smartsheet? Uses, Features and Pricing 14 Best Smartsheet Alternatives: Free & Paid Options Ranked (2025) Smartsheet vs. ProjectManager: Which Is the Better Project Management Software ProjectManager is online project and portfolio management software that connects teams, whether they’re in the office or out in the field. They can share files, comment at the task level and stay updated with email and in-app notifications. Join teams at Avis, Nestle and Siemens who use our software to deliver successful projects. Get started with ProjectManager today for free. The post Smartsheet Dashboard: Key Features, Pros and Cons appeared first on ProjectManager. View the full article
-
The best way to track projects is with cloud-based project management software that connects every task, timeline and team member in one platform. It allows managers to see progress in real time, track performance metrics and make fast adjustments without relying on outdated spreadsheets or manual updates. Teams can plan workflows, assign responsibilities and visualize progress across multiple projects using interactive dashboards and automated reporting tools. This software gives organizations complete control and transparency, helping them deliver work on time and within budget while reducing the risk of miscommunication. What Is the Best Way to Track a Project? The best way to track a project is by using project management software that provides real-time visibility into tasks, deadlines and resource allocation. This type of tool allows managers to monitor progress against baselines, identify delays early and keep all stakeholders informed. With live updates and performance metrics, teams can maintain alignment and ensure that each phase of the project stays on schedule and within scope. Project management software centralizes all project data in one platform, replacing scattered spreadsheets and manual reporting. It enables automatic tracking of tasks, budgets and workloads while offering multiple project views like Gantt, kanban, list and calendar. This not only saves time but also improves accuracy and collaboration by keeping everyone on the same page from start to finish. ProjectManager is the best option for tracking projects because it combines robust planning tools with real-time dashboards and AI-powered reports. Managers can instantly see progress across teams, update timelines, balance workloads and track costs. Unlike Excel or basic apps, ProjectManager integrates planning, collaboration and reporting in a single platform that scales with your business, making it the most effective and efficient choice for professional project tracking. Get started with ProjectManager today for free. /wp-content/uploads/2025/10/AI-Project-Insights-Lightmode-Dashboard-CTA.pngLearn more Best Ways to Track Projects by Project Management Software Tool There are many tools available for managing and monitoring work, but project management software provides the best way to track projects in real time. These tools give teams structure and visibility so they can meet deadlines, control costs and communicate effectively. Whether you’re leading small initiatives or large cross-functional programs, using the right view makes all the difference in keeping projects organized and on schedule. Below are some of the best ways to track projects using different project management software tools. Each view serves a specific purpose and helps teams visualize progress, allocate resources efficiently and make better decisions. From detailed planning to high-level reporting, these methods help ensure that every project stays on track from start to finish. 1. Gantt Charts: The Best Way to Track Projects With Task Dependencies and Complex Timelines Gantt charts are one of the best ways to track projects that involve multiple phases, interdependent tasks and strict deadlines. They provide a visual timeline showing how tasks relate to one another and how delays in one area affect the rest of the schedule. /wp-content/uploads/2024/02/Gantt-chart-construction-showing-project-task-cost-and-resources-600x262.webpLearn more Project managers can use Gantt charts to set baselines, assign tasks, link dependencies and monitor overall progress in real time. They also make it easy to adjust timelines when priorities change. With ProjectManager, Gantt charts automatically update as team members complete work, ensuring project data remains accurate and updated. This helps leaders forecast delays, identify bottlenecks and communicate changes effectively to stakeholders across departments. 2. Task Lists: The Best Way to Track Projects That Are Simple or Small Task lists are the best way to track projects that have straightforward workflows or smaller teams. They provide a clear breakdown of what needs to be done, who’s responsible and when tasks are due. Task lists help teams focus on immediate priorities without the complexity of advanced planning tools. /wp-content/uploads/2024/02/Task-Card-List-Light-Mode-Bid-Proposal-600x295.pngLearn more Managers can assign owners, set deadlines and check progress quickly, keeping everyone accountable. ProjectManager enhances task list tracking by syncing updates in real time and connecting each item to larger goals. Teams can easily filter tasks by priority, progress or due date, and switch to other views when projects grow more complex. This makes task lists a simple but scalable method for maintaining project clarity and control. 3. Project Dashboards: The Best Way to Track Projects Across an Organization Project dashboards are one of the best ways to track projects across multiple teams or departments. They provide instant visibility into project performance through key metrics like schedule progress, costs, workloads and task completion rates. Dashboards consolidate this data into visual charts and graphs, helping leaders spot risks or inefficiencies before they escalate. /wp-content/uploads/2025/10/AI-Project-Insights-Dashboard-Edited-Lightmode-600x284.pngLearn more With ProjectManager, dashboards update automatically as work is completed, ensuring accurate and current insights. Managers can customize views by department, portfolio or objective, creating tailored reports for executives or clients. This allows for data-driven decision-making, stronger communication and better alignment across the organization, making dashboards essential for enterprises managing several projects simultaneously. Related: 5 Google Sheets Dashboard Templates for Business and Project Management 4. Project Reports: The Best Way to Track Projects as a Stakeholder Project reports are the best way to track projects from a stakeholder’s perspective because they summarize key data on progress, performance and outcomes. Reports consolidate essential metrics like schedule variance, cost performance and resource utilization into clear visual summaries. This allows executives and clients to quickly understand whether goals are being met without reviewing detailed schedules. /wp-content/uploads/2024/06/Project-portfolio-status-report-600x328.pngLearn more ProjectManager simplifies this process with automated reporting tools that can generate status, variance or workload reports in seconds. Stakeholders can view or export these reports in multiple formats for presentations or governance meetings. With real-time data feeding directly from the project workspace, project reports ensure transparency, accountability and informed decision-making across every level of the organization. 5. Project Sheets: The Best Way to Track Projects’ Estimations vs. Actual Results Project sheets are the best way to track projects when comparing estimated values against actual results. They combine spreadsheet functionality with real-time data to monitor costs, timelines and resource usage side by side. Teams can input budget forecasts, expected durations and planned hours, then track live performance as the project progresses. This provides an instant understanding of where projects are on or off track. /wp-content/uploads/2024/05/Sheet-light-mode-punch-list-construction-custom-columns-costs-hours--600x328.pngLearn more In ProjectManager, project sheets update automatically as team members log time, complete tasks or adjust resources. Managers can apply filters, conditional formatting and roll-up summaries to evaluate overall accuracy and efficiency. This makes project sheets a powerful, data-driven tool for cost control and performance tracking throughout the project lifecycle. 6. Kanban Boards: The Best Way to Track Projects With Repetitive Workflows and Recurrent Tasks Kanban boards are the best way to track projects that involve ongoing, repetitive workflows such as agile sprints, maintenance tasks or marketing campaigns. They visualize work in columns labeled “To Do,” “In Progress” and “Done,” giving teams an instant view of project status. /wp-content/uploads/2024/04/Kanban-task-card-moving-manufacturing-order-management-light-mode-600x328.pngLearn more ProjectManager enhances kanban tracking with features like task automation, customizable workflows and drag-and-drop updates. Each card can store attachments, due dates and assignees, while color-coded tags make priorities easy to identify. Real-time sync ensures every team member sees the latest updates. Kanban boards encourage continuous improvement, limit bottlenecks and help maintain a steady workflow pace, making them ideal for teams managing recurring deliverables or multi-step production processes. Related: 32 Must-Have Project Management Templates for Google Sheets 7. Timesheets: The Best Way to Track Projects With High Labor Costs Timesheets are the best way to track projects that rely heavily on labor hours and workforce productivity. They help managers capture billable and non-billable time, monitor workloads and calculate actual costs against budgets. Accurate time tracking is essential for payroll, resource forecasting and project profitability. /wp-content/uploads/2024/05/timesheet-lightmode-good-version-lots-of-tasks-600x326.pngLearn more With ProjectManager, timesheets integrate directly into task assignments, allowing team members to submit hours online or from mobile devices. Managers can approve entries, generate utilization reports and identify where labor costs may exceed estimates. Real-time updates ensure financial data remains current, reducing errors and improving accountability. This seamless integration between tasks and timesheets gives organizations better control over time, cost and overall project performance. Related: 9 Free Timesheet Templates for Excel, Google Sheets & Word 8. Workload Charts: The Best Way to Track Projects That Require Labor-Intensive Work Workload charts are the best way to track projects that demand careful management of labor-intensive tasks. They provide a visual representation of team members’ assigned tasks, hours committed and capacity limits, allowing managers to prevent overload and balance workloads effectively. /wp-content/uploads/2023/01/Workload-Light-2554x1372-1-600x322.pngLearn more In ProjectManager, workload charts update automatically as tasks are assigned or completed, showing over-allocated resources in red for immediate action. Teams can filter by project, department or employee to identify bottlenecks. These charts help managers optimize assignments, maximize productivity and maintain a consistent workflow while ensuring labor-intensive projects stay on schedule without overtaxing personnel. 9. Project Status Reports: The Best Way to Track Projects With a Long Duration Project status reports are the best way to track long-duration projects, as they summarize progress over weeks or months. They highlight milestones, completed tasks, upcoming deadlines and potential risks, providing stakeholders and managers a clear overview without sifting through detailed schedules. /wp-content/uploads/2024/10/project-status-report-screenshot-2024-600x388.pngLearn more ProjectManager automates status report generation, pulling real-time data from tasks, timesheets and resource charts. Users can customize reports to focus on budget, scope or schedule performance and export them for governance meetings. Regular status reporting ensures transparency, allows for early corrective actions and maintains alignment across teams and stakeholders throughout extended project timelines. 10. Critical Path Method: The Best Way to Track Projects With Tight Deadlines The critical path method (CPM) is the best way to track projects that have tight deadlines because it identifies tasks that directly impact the overall project completion date. By mapping dependencies, durations and milestones, CPM highlights which activities must be completed on time to avoid delays. /wp-content/uploads/2025/06/ProjectManager-Gantt-Chart-Critical-Path-600x361.pngLearn more ProjectManager incorporates CPM into Gantt charts, automatically calculating the earliest start and finish dates and showing the critical path visually. Managers can adjust schedules, reassign resources and monitor task progress to prevent slippage. This ensures that even complex projects with strict timelines remain on track, allowing teams to focus on priority tasks and complete projects efficiently and reliably. 11. Earned Value Management: The Best Way to Track Projects With Tight Budgets Earned value management (EVM) is the best way to track projects with tight budgets because it integrates scope, schedule and cost to provide a clear measure of project performance. EVM compares planned work and costs against actual progress and expenditures, helping managers identify variances early. ProjectManager automates EVM calculations, showing cost performance index (CPI) and schedule performance index (SPI) in real time. Users can see whether tasks are under or over budget, adjust resources, and make informed decisions to prevent overspending. This method ensures that even financially constrained projects stay within budget while maintaining progress and quality standards. 12. Project Baselines: The Best Way to Track Projects When Conditions Are Known Project baselines are the best way to track projects when conditions are known because they establish a reference for scope, schedule and cost at the start of a project. Comparing actual progress against the baseline allows managers to identify deviations and implement corrective actions quickly. /wp-content/uploads/2021/01/set-baseline-1-600x300.jpgLearn more ProjectManager enables teams to set and update baselines within Gantt charts, highlighting changes in real time. By tracking performance against established baselines, managers can maintain control over deliverables, monitor schedule adherence and assess the impact of changes. Baselines provide a trusted benchmark, ensuring that projects are measured accurately, risks are mitigated and objectives are achieved efficiently. ProjectManager Is the Best Way to Track Projects of All Kinds ProjectManager is the best way to track projects of all kinds because it combines multiple project views, real-time dashboards, automated reporting and resource management tools in a single platform. Teams can use Gantt charts, kanban boards, project sheets and timesheets to monitor progress, manage workloads and control costs. AI-powered reporting and baseline comparisons provide instant insights while collaboration features keep everyone aligned. Unlike static spreadsheets or limited software, our software adapts to any project size or complexity, making it ideal for tracking deadlines, budgets and performance across teams, departments and entire organizations efficiently and accurately. Related Project Progress Tracking Content These are the best ways to track projects, but not the only ways. For readers to want to continue and explore this important topic, check out the links below. They lead to articles on time tracking, cost tracking and others. Project Time Tracking: Tools, Features and Software Reviews Project Cost Tracking: Process, Tools and Best Practices Tracking Budget Variance in Project Management Project Expense Tracking: 6 Ways to Track Project Costs ProjectManager is online project and portfolio management software that connects teams, whether they’re in the office or out in the field. They can share files, comment at the task level and stay updated with email and in-app notifications. Get started with ProjectManager today for free. The post 12 Best Ways to Track Projects With Project Management Software appeared first on ProjectManager. View the full article
-
U.S. lawmakers have tried four times since September last year to close what they called a glaring loophole: China is getting around export bans on the sale of powerful American AI chips by renting them through U.S. cloud services instead. But the proposals prompted a flurry of activity from more than 100 lobbyists from tech companies and their trade associations trying to weigh in, according to disclosure reports. The result: All four times, the proposal failed, including just last month. Following a long-heralded meeting between leaders Donald The President and Xi Jinping, the sale of U.S. technology to China remains among the thorniest issues the U.S. faces, with billions of dollars and the future of tech dominance at stake. But the tough talk about China obscures a deeper story: Even while warning about national security and human rights abuse, the U.S. government across five Republican and Democratic administrations has repeatedly allowed and even actively helped American firms to sell technology to Chinese police, government agencies, and surveillance companies, an Associated Press investigation has found. And time after time, despite bipartisan attempts, Congress has turned a blind eye to loopholes that allow China to work around its own rules, such as cloud services, third-party resellers, and holes in sanctions passed after the Tiananmen massacre. For example, despite U.S. export rules around advanced chips, China bought $20.7 billion worth of chipmaking equipment from U.S. companies in 2024 to bolster its homegrown industry, a report from a congressional committee this month warned. This reluctance to act reflects the tremendous wealth and power of the tech industry, which is more visible than ever under the The President administration. And in recent months, the president himself has struck grand deals with Silicon Valley firms that even more closely tie the U.S. economy to tech exports to China, giving taxpayers a direct stake in the profits for the first time. In August, The President announced a deal with chipmakers Nvidia and AMD to lift export controls on sales of advanced chips to China in exchange for a 15% cut of the revenue, despite concerns from national security experts that such chips will end up in the hands of Chinese military and intelligence services. The President said after Thursday’s meeting with Xi that China would follow up with Nvidia on the sales of chips but did not announce any resolution. The President also has announced that the U.S. government has taken a 10 percent stake in Intel worth around $11 billion. Longtime Chinese activist Zhou Fengsuo said the U.S. government is letting American companies set the agenda and ignoring how they help Beijing surveil and censor its own people. In 1989, Zhou was a student leader during the Tiananmen protests, where hundreds and possibly thousands were shot and killed by the Chinese government. Zhou was arrested and imprisoned. Now a U.S. citizen, Zhou testified before Congress in 2024, calling on Washington to investigate the involvement of American tech companies in Chinese surveillance. An AP investigation in September found that American companies to a large degree designed and built China’s surveillance state, playing a far greater role in enabling human rights abuses than previously known. “It’s driven by profit, and that’s why these strategic discussions have been silenced or delayed,” Zhou said. “I’m extremely disappointed. … this is a strategic failure by the United States.” Hundreds of millions in lobbying The sale of technology to China is contentious among both Republicans and Democrats, with some arguing for a harder stance. They are fighting a powerful opponent. An AP analysis of lobbying filings showed U.S. tech and telecom companies, as well as their trade associations, spent hundreds of millions of dollars over the past two decades on lobbyists who listed key bills impacting China-related trade on their quarterly disclosure reports, among other issues. Tech companies argue that further export restrictions will push China to develop its own domestic supply and strengthen its position in the global race for leadership in artificial intelligence. “Continuing to ban U.S. computing from commercial markets only benefits foreign competition and undercuts President The President’s efforts to create jobs, reduce the trade deficit, and grow the economy,” Nvidia said in a statement. Nvidia has also said that it does not make surveillance systems or software, does not work with police in China, and has not designed its H20 AI chip for police surveillance. Intel, which partnered with a Chinese fingerprinting company as recently as last year, has said the company follows export control policies, and did not address details of its deal with the U.S. government. “The U.S. government’s investment is a passive ownership, with no board representation, governance or information rights,” Intel said in a statement. AMD did not respond. The White House and the Commerce and State departments also did not respond to multiple requests for comment. The AP investigation was based on dozens of open record requests, hundreds of pages of congressional testimony, lobbying disclosures, and dozens of interviews with current and former Chinese and American executives, politicians, and former federal officials. Under the cloud services loophole, Chinese companies barred from accessing cutting-edge chips can use Microsoft Azure or Amazon Web Services overseas instead to train their AI models. Microsoft and AWS also both advertise the capacity to store video surveillance footage on their cloud services for Chinese customers. For example, SDIC Contech, a state-owned tech company that works with AI, sought access to AWS and Microsoft Azure big data analytics services, procurement bids show. And Shanghai Qi Zhi Institute, a government-backed research institute working on sensitive technologies such as encryption, sought access to $280,000 worth of Azure OpenAI cloud services from Microsoft. Even sanctioned Chinese companies can use AWS and Microsoft Azure to offer surveillance abilities to customers overseas. For example, despite U.S. sanctions over human rights abuses in Xinjiang in 2019, Dahua and Hikvision, China’s two largest surveillance companies, use AWS to offer networked surveillance abroad, according to marketing material on the company websites. Hikvision markets a video surveillance platform called “HikCentral” to private companies overseas, which can be also deployed on Azure, according to a post on Hikvision’s website this year. Microsoft denied providing services to Hikvision or partnering with them to provide services to others. OpenAI, which provides its advanced AI models through Microsoft’s Azure cloud platform, said it was subject to Microsoft’s policies and doesn’t support China’s access to its services. AWS did not respond on the record to questions about the cloud services loophole. Another enduring loophole is in the restrictions passed after the Tiananmen massacre that didn’t include newer policing technologies, such as security cameras, surveillance drives, or facial recognition systems. In 2006, 2007, 2009, 2011 and 2013, lawmakers introduced bills to try and close the loophole. All failed. The U.S. government under both Republican and Democratic presidents has made other attempts to regulate tech surveillance exports to China. In 2008, the Department of Commerce asked for comment on whether to include “biometric devices” and “integrated security systems” under controlled exports, but ran out of time before the next administration came in. In 2014 and 2015, it tried to tighten controls on surveillance products, but most fell through. In 2024, it sought to restrict exports of face-recognition systems and bar many more military, police, and intelligence end users from receiving U.S. goods, with no success. Some politicians on both sides of the aisle blame the failures in part on the money and political influence of tech companies. “I think we’ve been naive or complicit in the extreme,” said New Jersey GOP Rep. Chris Smith. The U.S., he said, has been “selling and conveying to a malevolent power the ability to destroy us and destroy like-minded Western democracies.” “What do all those companies all have in common? A big wallet,” said Ron Wyden, a Democratic senator from Oregon. “That is as much as anything is what’s behind the fact we haven’t made as much progress.” A history of failures to close loopholes The first round of U.S. prohibitions on Chinese police came after the Tiananmen massacre and applied to “crime control and detection” equipment. They largely stopped U.S. companies from exporting goods to Chinese entities such as restraints, helmets, shields and batons. But the controls were narrowly confined to largely low-tech goods, leaving out advanced technologies that could be used by police and leading at times to puzzling priorities. U.S. regulators warned sex shops against shipping novelty gold handcuffs to China. At the same time, they broadly permitted Silicon Valley companies to sell routers, servers, software, and, more recently, AI-powered surveillance systems to Chinese police. For example, despite explicit restrictions on fingerprint recognition systems, U.S. companies still were able to sell gear to process, store and compare fingerprints. In 2006, with bipartisan support, Smith introduced the Global Online Freedom Act to curtail the involvement of American tech companies in Chinese surveillance. Smith drew parallels with IBM’s sale of computing gear to Nazi Germany, which has been well documented by historians. IBM told AP in a follow-up statement that the claim that IBM knowingly collaborated with Nazi Germany was “false and has been rejected by credible historians.” Associations representing the tech and telecommunications industries and dozens of companies stepped up their lobbying against Smith’s proposal, disclosures show. The companies argued the computers, servers and routers they sold in China were no different from what they sold to other countries. Industry groups and individual companies also submitted hundreds of comments to regulators, hoping to influence China-related export regulations. Smith’s bill went nowhere. “Money talks … When they flood certain members on strategic committees with the money, PAC money and the like, how much easier it is to listen to their narrative that somehow they’re part of the reform?” said Smith. Tech sales to China continued, sometimes with direct government support. Numerous archived webpages show that the U.S. Commercial Service, the export-promoting arm of the Commerce Department, played a crucial role for more than a decade in connecting U.S. vendors to Chinese security agencies and key government officials, including through its marquee Gold Key Matching service. In 2004, the Commercial Service invited American companies selling security technologies and equipment to show off their products at a Chinese security exposition. Two years later, it advertised opportunities for American firms in the “safety and security” market, followed by another publication later describing market opportunities for foreign security products such as inspection control and guard communication systems. Archived webpages also show that under both the George W. Bush and Obama administrations, the Commercial Service steadily promoted U.S. participation in policing trade shows, even those that showcased “biological identification technologies” or were initiated by the Chinese Communist Party. Under Bush, the Commerce Department in 2007 hosted a webinar about how to sell to the Chinese security market and promote surveillance tools to China’s public sector. For just $35, the federal agency could offer attendees “market entry-strategies and long-term market penetration plans,” an archived webpage shows. Jeanette Chu, who then worked at the U.S. Embassy in Beijing and helped give the 2007 webinar, recalled sometimes having concerns. “I used to ask myself all the time, ‘what is the scary potential of each item?’” said Chu, now a national security and trade expert advising industry. Despite promises to nail shut Washington’s revolving door, President Barack Obama — like presidents before and after him — gave former industry lobbyists and allies top jobs, including Eric Hirschhorn in the Commerce Department, who represented a trade group that lobbied for tech companies exporting abroad. Hirschhorn wrote that Beijing’s surveillance abilities were nothing compared to the half-million surveillance cameras blanketing London. He was put in charge of the office that administers U.S. export controls. In an interview, Hirschhorn said export controls alone were an inefficient way to defend human rights. “You can use a computer to type an order or type a love note,” he told AP. “Are you not going to sell computers to China because one out of every 10,000 of them will be used to store data about a dissident?” In 2010, the U.S. State Department’s human rights report warned of “police surveillance, harassment and detentions of activists.” Yet U.S. Ambassador Jon Huntsman led a mission to promote American business interests in the far-west region of Xinjiang, where authorities had arrested thousands of ethnic Uyghurs and cut internet access after deadly unrest the year before. Huntsman did not respond to requests for comment. That same year, the Commercial Service spotlighted opportunities for U.S. companies to sell equipment directly to China’s central government “to install a city-wide infrastructure of security, surveillance, and alarm systems” on its website. A 2015 State Department draft plan for “smart city” cooperation obtained by AP proposed that China and the U.S. collaborate on joint research, such as on crime and “urban security,” and include private sector players such IBM. Additional documents AP obtained via a Freedom of Information Act request show the U.S. government also sought active counter-terrorism cooperation with China, which gave tech companies a chance for closer contact with Chinese authorities even as Beijing broadly labelled protest or dissent among Uyghurs as terrorism. Kevin Wolf, then an assistant secretary in charge of export controls at Commerce, said as news about human rights abuses inside China kept surfacing, he worried about U.S. innovations falling into the wrong hands. Wolf said he began drafting a rule to regulate certain surveillance gear sales in early 2016. “The problem I was struggling with was, mass surveillance can involve everyday ordinary common items: it’s cameras, it’s software, it’s facial recognition stuff and 99 percent of all of those applications are perfectly benign,” said Wolf, now a compliance attorney for industry. “So if you were to say, ban cameras that can read someone’s face, you blow up international trade.” Wolf’s colleagues told him the draft rule was too complicated, Wolf said, and it foundered. In 2018, Congress passed the Export Control Reform Act, giving Commerce authority to make export control rules about advanced technologies. In 2019 and 2020, the The President administration sanctioned some Chinese officials and surveillance firms over atrocities in Xinjiang. But sales of surveillance equipment continued, albeit at a slower pace — though references to working with the Chinese police would disappear from annual Commerce Department reports for U.S. industry. In 2021, Joe Biden put out an executive order describing Chinese surveillance tech companies as “unusual and extraordinary threats” that enabled serious human rights abuses. In his final months in office, Biden’s administration drew up sprawling rules for exporting advanced computer chips used to develop AI systems. Commerce also floated an updated version of Wolf’s draft rule to keep facial recognition and other mass surveillance tools from reaching military and intelligence agencies and companies, including in China. But once again, Washington lobbyists, lawyers and politicians pushed back. “The result would slow business considerably and likely result in the loss of customers that do not present any national security or human rights concerns,” said a Chamber of Commerce filing from late last year. The proposed rule, in the end, stalled out. Gulbahar Haitiwaji, an ethnic Uyghur living in France, says little has changed since she testified to Congress in 2023 urging the U.S. government to “stop American companies from continuing to be complicit in surveilling our people”. Haitiwaji was arrested and detained in internment camps in Xinjiang for more than two years, after policing systems based on U.S. technology led Chinese officers to identify her as a “terrorist.” She was under constant, excruciating surveillance, with cameras watching her even in the toilet. After she was released in 2019, she still found herself living in what she calls “an open-air prison,” with every move monitored, until she finally left Xinjiang later that year. She said U.S. tech companies show little accountability. “It’s truly disappointing that the United States, one of the most powerful countries in the world, would sell such technology to China despite knowing the potential for serious consequences,” Haitiwaji said. —By Garance Burke, Dake Kang, and Byron Tau, Associated Press Former AP journalist Trenton Daniel contributed to this report. View the full article

-
We may earn a commission from links on this page. Deal pricing and availability subject to change after time of publication. Target has joined Walmart and Best Buy in unveiling its Black Friday sale plans. Target will be holding multiple sale events leading up to Black Friday across departments, including clothes, toys, electronics, and more. Here's everything you need to know about the upcoming sales. What sales will Target have for Black Friday?Target says it will have week-long deals every Sunday starting Nov. 2 through Dec. 24. It'll also have "Deal of the Day" sales with items going up to 50% off. Then, there will be an official Early Black Friday Sale followed by an actual Black Friday sale. If you happen to buy something from Nov. 1 through Dec. 24 that drops in price later, Target will match the price for you and refund you the difference. When will Target's Black Friday sales be?Here are all the sales Target will have: Deal of the Day: From Nov. 1 through Dec. 24. Week-long deals: Every Sunday from Nov. 2 through Dec. 24. Early Black Friday Sale: A three-day event from Nov. 6 to 8. Black Friday Sale: Black Friday starts online Thursday, Nov. 27, and in stores Friday, Nov. 28. Holiday Price Match Guarantee: From Nov. 1 through Dec. 24. What deals will Target have for Black Friday?Target will have deals on gifts, holiday decor, toys, clothing, kitchen essentials, and more. Here are some deals Target has already publicized: 40% off pajamas for all. 40% off women and kids’ sweaters, sweatshirts, and sweatpants. 40% off select holiday decor and lights. 40% off select LEGO. 40% off Cat & Jack toddler tees, shorts, and dresses. 40% off Champion. 40% off holiday sheets. Up to 50% off small appliances and floorcare, including Ninja. Up to 50% off select toys, including Barbie, FAO Schwarz, and Hot Wheels. 30% off women’s and men’s Levi’s clothing. Do you need to be a member to shop Target's Black Friday sale?You will need to be a Circle member to take part in the sale, but unlike a Prime membership, Target Circle is free. You can sign up for an account on the Target app or Target.com. You can also pay for a Target Circle 360 membership, which grants you early access to the sale as well as other perks, like same-day delivery. If you're a government assistance recipient or a student, you can save 50% on the one-year Circle 360 subscription; otherwise, it starts at $10.99 per month. But again, a paid membership isn't necessary to get all the best deals. What are other retailers doing for Black Friday?Best Buy's sales run from Oct. 31 until Dec. 24. It’s an especially good option if you’re a My Best Buy “Plus” or “Total” member. Walmart is having deals from November 14 to December 1. Amazon hasn't announced its sales plans yet, but it should do so soon. View the full article
-
Hurricane Melissa, which made landfall in Jamaica on Tuesday, October 28, was one of strongest hurricanes to make landfall in the Atlantic ocean ever recorded. And it was supercharged by the effects of climate change. As it approached the Caribbean, Melissa—a Category 5 storm with winds of 185 mph—moved over exceptionally warm waters. The ocean was 2.2°F (or 1.2°C) warmer than average for this time of year—conditions that were “made up to 900 times more likely by human-caused climate change,” according to the scientists at the research nonprofit Climate Central. Carbon emissions from human actions trap heat in the atmosphere, but our oceans absorb most of that heat—about 93% since 1970. As the storm moved over those warm waters, it rapidly intensified. In just 24 hours, from October 25 to 26, its wind speeds doubled from 70 miles per hour to 140—turning it from a tropical storm into a Category 4 Hurricane. This level of intensification is “at the extremes of what has ever been observed,” according to scientists at Imperial College London. Then, the hurricane intensified again, reaching Category 5 strength and becoming one of the most powerful hurricanes ever recorded in the Caribbean. It’s an example of the way global and ocean warming, caused by human activity like the burning of fossil fuels, is increasing both the likelihood and intensity of storms. Climate change made Melissa more likely—and more damaging In a cooler world that wasn’t experiencing climate change, a hurricane like Melissa would have made landfall in Jamaica once every 8,000 years. But in today’s world, climate change made Hurricane Melissa four times more likely to occur, according to a rapid analysis by scientists at Imperial College London. Climate change also made Melissa’s wind speeds about 10 miles per hour stronger, according to a rapid attribution study by Climate Central. And it made the storm more damaging overall. A world without climate change would have seen a hurricane that was about 12% less damaging, per Imperial College London’s analysis. That difference is relatively small because, as the researchers note, “an event of this severity already causes near maximal damage.” But it still signifies how climate change is making extreme weather events even more destructive. Preliminary reports put the direct damage from Melissa on Jamaica’s physical assets at $7.7 billion. That’s more than a third of the country’s GDP. AccuWeather estimates an even more destructive picture: $22 billion for the storm’s total damage and economic loss, including not only destroyed homes and businesses, but tourism impacts, financial losses from power outages, travel delays, impacts on shipping, and so on. Extreme storms are becoming more common As climate change worsens—fueled by our continual use of fossil fuels and increasing global carbon emissions—extreme storm behavior like we saw with Hurricane Melissa will become more common, and could get even more intense. “These storms will become even more devastating in the future if we continue overheating the planet by burning fossil fuels,” Professor Ralf Toumi, director of the Grantham Institute—Climate Change and the Environment at Imperial College London, said in a statement. “Jamaica had plenty of time and experience to prepare for this storm, but there are limits to how countries can prepare and adapt,” he added. “Adaptation to climate change is vital but it is not a sufficient response to global warming. The emission of greenhouse gases also has to stop.” The effects of climate change don’t necessarily mean, however, that we’ll see more storms every season, or that every single storm will be this strong. “Maybe the most important thing to understand about hurricanes in the warming world is that not all of them will be able to take advantage of the raised ceiling from ocean warming, but some of them will, and this one did,” Daniel Swain, a climate researcher at UCLA, told CNN. “And when we have situations like this, where it happens near or over a populated area that is susceptible to major effects, that the subsequent devastation will have been made worse, significantly worse, by climate change.” View the full article

-
Workload distribution is the backbone of a productive, high-performing team. In this article, we’ll unpack what it really means, why getting it right matters more than you might think, and how thoughtful workload distribution can improve collaboration, reduce burnout, and help your team consistently deliver their best work. The post Workload Distribution for Project Managers: Best Strategies to Balance the Load appeared first on The Digital Project Manager. View the full article
-
FFIN 2025-3's average loan balance, $16,366 was lower compared with the 2025-2 deal, when it was $19,993, and the WA interest rate on the current deal is 12.15%, down from 12.56%. View the full article