
ResidentialBusiness
Administrators
-
Joined
-
Last visited
Everything posted by ResidentialBusiness
-
 I really like the iPhone's Dynamic Island, the pill-shaped cutout near the top of the device's screen. It's an aesthetically pleasing way to check your battery percentage, record voice notes, and control music playback, among many other things. Since many MacBooks have a display notch too, you can use an app to bring an iPhone-like Dynamic Island to your laptop. Doing this makes the cutout look like a useful design feature rather than an abrupt gap in the screen, and some apps even let you move the giant volume and brightness adjustment popups to the Dynamic Island. Alcove brings the Dynamic Island to your Mac Credit: Pranay Parab I've been using Alcove on a MacBook without a notch and I'm still finding it pretty useful. This app's developer is known to focus on design, just as they did with Klack—an app that makes your Mac's keyboard sound vintage. Alcove's neat status updates highlight useful information in a slick interface. It takes over your Mac's volume and brightness adjustment popups and moves those to the notch. This is a better implementation than Apple's giant popups, which hide a significant part of the screen temporarily—a problem they've since fixed on iOS. You can also use Alcove to keep a tab on Focuses, changes in songs, and access playback controls. The app can even show some of these changes on your Mac's lock screen. I also like the app's animations, from the small visualizer that shows up when you play music to the different themes of the brightness and volume sliders. If you choose the Glow theme for the volume slider, the color of the slider changes from green to red when you exceed 80% volume. Credit: Pranay Parab This app supports gestures, so you can use horizontal two-finger swipes on your MacBook to skip to the next song or go back to the previous song. You can use vertical swipes to expand playback controls or to dismiss live activities that show up in the notch. You can try all of the app's features for a couple days without paying, and once the free trial is over, you'll have to pay $17 to continue using the app. The price may be a bit steep for someone who just wants music playback controls and nothing else, but Alcove is among the few apps that truly recreates the iPhone's Dynamic Island on your Mac, right down to all the delightful animations. Other useful notch appsThere are lots of other apps that make good use of the MacBook's notch, but these are my favorites: Notchnook ($25): This is another well-designed app and offers a few more features than Alcove and costs a bit more. You get more widgets, shortcuts, and even a mirror that lets you check your frame before a video call. Notchnook's file tray lets you quickly AirDrop files or store them in a temporary shelf, which makes it easy to move files around. Mediamate (€7): You can use this app for music controls, to slim down the massive brightness and volume controls, and to choose where to place those control sliders. You can place them in the notch or use slimmer sliders in the middle of the screen. Tuneful ($4): This one is a music-focused notch app, which lets you connect to both Apple Music and Spotify. You can use it to show playback controls and the currently playing song in the notch, but it also includes gesture-based playback controls. In case you don't want it in the notch, you can enable its mini player to show the album art and playback controls in other areas of the display. View the full article
 -
Federal Reserve Gov. Lisa Cook said in a speech Friday that the market's response to recent volatility shows resilience, but more study is needed about the financial stability implications of business relationships between banks and nonbanks. View the full article

-
Here’s everything you need to know about setting up an integration that syncs Azure DevOps and HubSpot work items with an automated 2-way sync through Unito. Since Unito is a no-code, fully customizable platform you can set up your first secure integration without any IT resources. You won’t need to troubleshoot scripts or work with expensive consultants, either. More of a visual learner? Learn how to set up a Unito flow in this video tutorial. In this article: Why sync Azure DevOps and HubSpot? Step 1. Connect Azure DevOps and HubSpot to Unito Step 2. Choose a flow direction for new work items Step 3. Set rules to exclude work items from syncing Step 4. Configure Azure DevOps and HubSpot fields Step 5. Launch your Azure DevOps-HubSpot integration Why sync Azure DevOps and HubSpot? Azure DevOps (ADO) is an essential part of many software development workflows. It’s where your developers get their work done, where they plan upcoming sprints, and where they collaborate seamlessly. But, in most organizations, ADO is a major silo. As much as it helps developers collaborate among themselves, it keeps everyone locked out of their essential work. HubSpot, on the other hand, is the centerpiece of all revenue-generating workflows in your organization. Sales deals move through pipelines in HubSpot, marketers pull customer data from the content they create in HubSpot, and your customer success team might work exclusively in HubSpot. This is a silo of its own, completely blocked off to software developers. This wouldn’t be an issue if some of your organization’s essential workflows didn’t depend on collaboration between teams in HubSpot and Azure DevOps. Workflows like: Streamlining support ticket escalation. Monitoring development on dealmaking features. Integrating product launches in marketing campaigns. Improving the new feature to help center article pipeline. Now let’s break down how it’s done. Step 1. Connect Azure DevOps and HubSpot to Unito Sign up for Unito if you haven’t already. Navigate to the Unito App and click +Create Flow. Click Start Here to connect Azure DevOps and HubSpot. Click +Choose account for each tool and complete the authorization process. Click Confirm. When you’re ready, click Confirm. Is this your first time connecting tools to Unito? Check out this guide for more in-depth instructions. Authorizing ADO to sync with Unito Before you sync any Azure DevOps work items, Third-party application access via OAuth needs to be turned on. To do this, go to Organization Settings in ADO and click on Policies. Then, toggle on the Third-party application access via OAuth option. This is essential to connect Azure DevOps to Unito. Step 2. Choose flow direction for new work items When you create new Azure DevOps or HubSpot work items, Unito creates synced versions in the other tool automatically. With flow direction, you determine where that happens: 2-way, meaning new Azure DevOps and HubSpot items will be created to match work items in either tool. 1-way from Azure DevOps to HubSpot, which creates new HubSpot work items to match those you create manually in Azure DevOps. Creating work items manually in HubSpot won’t create new Azure DevOps items. 1-way from HubSpot to Azure DevOps, which creates new Azure DevOps work items to match those you create manually in HubSpot. Creating work items manually in Azure DevOps won’t create new HubSpot items. Step 3. Set rules to sync specific Azure DevOps and HubSpot work items Rules give you finer control over your Unito flows, allowing you to do two things: Filter out work items you don’t want to sync between tools based on specific fields. You could, for example, set a rule that only syncs HubSpot deals with a specific owner or Azure DevOps items with a certain tag. Automate certain actions so synced work items are always created where and how you need. For example, you could have new HubSpot deals automatically land in the New stage of your pipeline or automatically set the state for an Azure DevOps item. To start creating a rule, click Add a new rule. Then choose what will trigger that rule and what happens when it’s triggered. You can learn more about setting rules here. Step 4. Map fields between Azure DevOps and HubSpot Field mappings pair fields in Azure DevOps with fields in HubSpot so your data goes exactly where it needs to, whether these fields have the same name (e.g., Assignee to Assignee) or not (e.g., Create Date to Created At). When it’s time to map your fields, you can either let Unito do it for you by clicking Map automatically or click Map manually to customize them yourself. You can customize field mappings later even if Unito maps them automatically. When you’ve mapped your fields, you’ll see something like this. From here, click +Add mapping then Select a field to sync additional fields. Unito automatically recommends compatible fields for any field you add here through a drop-down menu. Some fields have a cog icon, meaning they can be customized further. For example, a Priority field can be customized to match specific options in another field. Step 5. Launch your Azure DevOps-HubSpot integration That’s it! You’re ready to launch your first flow. Once you do, Unito will automatically sync Azure DevOps and HubSpot items, keeping all fields you map up to date automatically. Ready to optimize your pipeline? Meet with our team to see what Unito can do for your workflows. Talk to sales What’s next? Need to integrate Azure DevOps or HubSpot with other tools in your stack? Check out our other guides below: Connecting Airtable to Azure DevOps Integrating Asana and Azure DevOps Syncing Azure DevOps and Salesforce Connecting HubSpot to ServiceNow Integrating HubSpot and Jira Syncing HubSpot and Google Sheets View the full article
-
I don't mean to be alarmist, but I do think it's time to start assuming everything you see online is fake. The internet is full of content produced by real people, of course (this article included). But AI-generated media is getting so realistic, that it almost puts you at a disadvantage to presume the content you're scrolling past on your feeds is legitimate. Don't skip this article because you know what AI content looks like—the current stuff your algorithm delivers to your social media feeds is easy to spot if you know what you're looking for. But even if you can identify AI slop the second it hits your eyeballs, you need to know you're not ready for the next wave of AI-generated videos. That wave isn't just on its way—it's already here. AI content is already fooling peopleMost of us are acutely aware of the "AI video" look: This "tragic" video of a cat parent saving their kitten by throwing it out of a burning airplane is obvious AI slop to most who watch it. You probably know The President isn't working this construction site, and you most assuredly can understand this family of cat farmers is, in fact, AI-generated. But there are the videos that aren't so obvious, especially to those of us not quite so in tune with AI, or technology in general. You might know this video of babies dancing in a circle is AI, but plenty of the people in the comments didn't (assuming they aren't bots, either). You might also be able to tell that this family of pets isn't really watching a bird investigate a toy alligator, but, again, plenty can't. And there is no end to the America's Got Talent videos that feature "realistic" yet impossible visuals—that still capture the hearts of hundreds of thousands, if not millions of people. (I weep.) But I'm not writing this piece today because I'm concerned about how many of these "believable" AI videos are tricking way too many people into thinking they're real. I am worried about that, but those worries pale in comparison to my new fears. So far, most of the AI videos taking over social media feeds rely mainly on their visuals and background sounds to sell their alleged authenticity. You'll notice none of the characters in any of these videos actually speak. If they do, it's immediately off-putting, with out of sync lip movements and, typically, robotic voices. It's been easier for AI creators to put the emphasis on the realism of the people and animals in their videos, and hope you're wowed enough by a baby dancing with a lion to not think, "this is bullshit, right?" Even OpenAI's Sora video model, which shocked me with its quality in February of last year, was working off of its realistic visuals. A video of woman "filming" her reflection through a train window too real for comfort, but Sora wasn't spitting out fully-rendered conversations. If you see such a scene on your feeds, you probably assume, of course, it's a real video—or at least one generated by humans. AI video is about to change completelySomething happened this week that only made me more pessimistic about the future of truth on the internet. During this week's Google I/O event, Google unveiled Veo 3, its latest AI video model. Like other competitive models out there, Veo 3 can generate highly realistic sequences, which Google showed off throughout the presentation. Sure, not great, but also, nothing really new there. But Veo 3 isn't just capable of generating video that might trick your eye into thinking its real: Veo 3 can also generate audio to go alongside the video. That includes sound effects, but also dialogue—lip-synced dialogue. In order to demonstrate Veo 3's audio/video capabilities, Google showed off a clip of an old sailor at sea. The video quality is sharp and realistic, and the words the man speaks are synced to his lip movements. Of course, knowing the video is AI, you notice quirks that give away the game (to my eye, this looks like a high quality animation more than a live action shot) but I am quite confident this video would fool a lot of fans of fake AGT videos. But even this clip wasn't what inspired my newfound fears—it was the videos that users started making once they got their hands on Veo 3. PetaPixel has a great roundup of some of the "best" Veo 3 videos people have made so far, but I'll highlight some of the ones that should scare you most. This clip shows a streamer playing Fortnite. Everything, including the game footage, was generated with Google's AI: This Tweet is currently unavailable. It might be loading or has been removed. This clip shows three concerts that never happened, featuring musicians and crowds that do not exist. The music isn't good, but that's not the point. The music, from the vocals to the instrumentals, was generated entirely by the AI, and then synced to lips, drums, guitars, and strings: This Tweet is currently unavailable. It might be loading or has been removed. But this clip is, without a doubt, the one that should sound the alarm for each and every one of us. Someone generated a fake video of a fake car show, featuring fake interviews with fake attendees. It's far from perfect, but any AI quirks are totally overshadowed by the surface-level realism here. Not only would the AI's Got Talent fans buy this, I would buy this, especially if I wasn't looking out for it: This Tweet is currently unavailable. It might be loading or has been removed. It's the visuals; it's the dialogue; it's the crowds; it's the lighting; it's the candid laughter at "mistakes;" it's the sound of the mic being "bumped" into. Congratulations on noticing the dialogue often doesn't make sense, or that the people in the background defy the laws of physics—you won't notice it when it hits mid-scroll on TikTok or Instagram. Even Veo 2, which isn't as powerful as Veo 3, now offers tools for realism, like the ability to dictate how you want the camera to move. And both models are available in Flow, Google's AI video editor of sorts. Creators now have the ability to generate highly realistic AI content that feels like it was filmed in-person, and the tech is only getting better. This Tweet is currently unavailable. It might be loading or has been removed. Google's best AI video generator tools cost $250 a month through its new AI Ultra subscription plan. That's expensive, but not out of reach for plenty of people interested in making AI-generated content. But the $20 per month plan, AI Pro, still comes with Veo 2 and Flow access. The rate limits are lower, but I wouldn't be shocked to see some realistic slop come out of those limitations, too. It's time to be a full-time skepticNone of this tech is perfect. I'm not here to tell you that everything Veo 3 spits out is indistinguishable from real content, or that the videos are absent any of the usual AI tells. In fact, there's clearly something up with Veo 3's training data: As 404 Media reports, the model continuously generates the same weird "dad joke" whenever you ask for a generation of a comedian performing standup. What I'm saying is, it's time to turn on your bullshit detectors and keep them active full time. When engaging with videos on the internet—especially short-form algorithmic clips—you might be safer operating under the assumption the content is fake from the jump, and require proof beyond a reasonable doubt that what you're seeing wasn't generated with a simple prompt and a $250 budget. That feels extreme, but after what I've seen this week, I don't really see another way to engage with this content going forward. We're in scary territory now. Today, it's demos of musicians and streamers. Tomorrow, it's a politician saying something they didn't; a suspect committing the crime they're accused of; a "reporter" feeding you lies through the "news." I hope this is as good as the technology gets. I hope AI companies run out of training data to improve their models, and that governments take some action to regulate this technology. But seeing as the Republicans in the United States passed a bill that included a ban on state-enforced AI regulations for ten years, I'm pretty pessimistic on that latter point. In all likelihood, this tech is going to get better, with zero guardrails to ensure it advances safely. I'm left wondering how many of those politicians who voted yes on that bill watched an AI-generated video on their phone this week and thought nothing of it. View the full article
-
Google reduced the minimum audience size requirement for customer match lists in Search campaigns from 1,000 to just 100 users — a significant update for small and midsize businesses. The big picture. This update makes precision targeting more accessible to SMBs, who often struggle to meet high list-size minimums. According to Google’s documentation, the new threshold applies only to customer match lists — not to remarketing lists or other audience types. It also mirrors YouTube’s recent customer list minimums, signaling a broader push for consistency across Google’s platforms. Why we care. Previously, advertisers needed at least 1,000 users to qualify a customer list for use in search ads. Now, with only 100, this makes highly targeted, intent-driven ads accessible to smaller brands that couldn’t previously meet the threshold. It levels the playing field, allowing SMBs to compete more effectively and stretch their marketing budgets further with precision audience targeting on Google Search. Between the lines. This isn’t just a technical change — it’s a strategic shift. With tighter privacy norms, Google appears to be exploring how to maintain targeting precision without massive data pools. What they’re saying. “This is an amazing development and a huge win for SMBs!” — Navah Hopkins, Brand Evangelist of Optmyzr, who first surfaced the change. She credits Google Ads Consultant, Boris Beceric for the tip, and teases more insights during their upcoming GML recap, promising “rants, tactics, and at least one song recommendation.” What’s next. Hopkins speculates that this move could pave the way for greater transparency around search term data — another long-requested feature by advertisers. Bottom line. Small advertisers just gained a powerful new way to compete — and Google may be signaling a more inclusive future for ad targeting. View the full article
-
Brazilian meat giant JBS came a step closer Friday to its long-held goal of trading its shares on the New York Stock Exchange. The company’s minority shareholders voted to approve the company’s plan to list its shares both in Sao Paulo and New York, casting aside opposition from environmental groups, U.S. lawmakers and others who noted JBS’ record of corruption, monopolistic behavior and environmental destruction. JBS Global CEO Gilberto Tomazoni said the outcome showed shareholders were confident in the benefits a dual listing would bring. The company said before the vote that listing shares in the U.S. would boost its global profile and attract new investors. JBS said it expected to begin trading on the New York Stock Exchange on June 12. The U.S. Securities and Exchange Commission granted the company’s request to list its shares in New York late last month. JBS is one of the world’s largest food companies, with more than 250 production facilities in 17 countries. Half of its annual revenue comes from the U.S., where it has more than 72,000 employees. It’s America’s top beef producer and it’s second-largest producer of poultry and pork. JBS’s plan—which has been in the works for years—has generated significant pushback. Last fall, 20 environmental organizations—including Mighty Earth, Greenpeace and Rainforest Action Network—signed an open letter to JBS investors opposing the listing, saying it would put the climate at greater risk. Glass Lewis, an influential independent investor advisory firm, was also among those recommending that shareholders reject the plan. In its report, Glass Lewis said the recent return of brothers Joesley and Wesley Batista to the JBS board should concern investors. The brothers, who are the sons of JBS’ founder, were briefly jailed in Brazil in 2017 on bribery and corruption charges. “In our view, the involvement of the company and of Joesley and Wesley Batista in multiple high-profile scandals has tarnished the company’s reputation, undermining stakeholder trust and posing a significant risk to its competitive position,” Glass Lewis said. Glass Lewis also objected to the company’s plan for dual share classes, which would give the Batistas and other controlling shareholders more voting power. In its response to Glass Lewis’ report, JBS said it has established more stringent controls and anti-corruption training at the company in recent years. It also said a U.S. listing would ensure more oversight from U.S. authorities. “We believe this transaction will increase our visibility in global markets, attract new investors and further strengthen our position as a global food industry leader,” Tomazoni said in a statement last month when the company announced Friday’s vote. Many U.S. lawmakers also aren’t convinced JBS belongs on the New York Stock Exchange. In a letter sent last week to JBS, U.S. Sen. Elizabeth Warren, a Massachusetts Democrat, noted that Pilgrim’s Pride—a U.S. company owned by JBS—was the largest single donor to President Donald The President’s inaugural committee, with a $5 million gift. The SEC’s approval came just weeks after that donation, Warren said. “I am concerned Pilgrim’s Pride may have made its contribution to the inaugural fund to curry favor with the The President administration,” Warren wrote in the letter, which asked the company why the donation was made. In a statement, JBS said it has a “long bipartisan history of participating in the civic process.” Warren was also among a bipartisan group of 15 U.S. senators who sent a letter to the SEC in January 2024 urging the agency to reject a U.S. listing for JBS. The senators, a diverse group that rarely agrees on policy, included Republicans Marco Rubio of Florida and Josh Hawley of Missouri, Democrat Cory Booker of New Jersey and Independent Bernie Sanders of Vermont. The letter noted that in 2020, J&F Investments, a controlling shareholder of JBS that is owned by the Batista family, pleaded guilty to bribery charges in U.S. federal court and agreed to pay fines of $256 million. It also said Pilgrim’s Pride pleaded guilty to price-fixing charges in 2021. And it said U.S. Senate investigations found that JBS is “turning a blind eye” to rainforest destruction in the Amazon by its suppliers. “Approval of JBS’ proposed listing would subject U.S. investors to risk from a company with a history of blatant, systemic corruption, and further entrench its monopoly power and embolden its monopoly practices,” the letter said. —Dee-Ann Durbin, AP business writer View the full article

-
Iran and the United States prepared for a fifth round of negotiations over Tehran’s rapidly advancing nuclear program Friday in Rome, with enrichment emerging as the key issue. U.S. officials up to President Donald The President insist Iran cannot continue to enrich uranium at all in any deal that could see sanctions lifted on Tehran’s struggling economy. Iran’s Foreign Minister Abbas Araghchi early Friday insisted online that no enrichment would mean “we do NOT have a deal.” “Figuring out the path to a deal is not rocket science,” Araghchi wrote on the social platform X. “Time to decide.” The U.S. will be again represented in the talks by Mideast envoy Steve Witkoff and Michael Anton, the State Department’s policy planning director. Oman’s Foreign Minister Badr al-Busaidi is mediating the negotiations as the sultanate on the Arabian Peninsula has been a trusted interlocutor by both Tehran and Washington in the talks. A car carrying Araghchi arrived at the Omani Embassy in Rome’s Camilluccia neighborhood around 12:30 p.m. Witkoff had yet to be seen, but the embassy previously served as the site of another round of talks. Enrichment remains key in negotiations The talks seek to limit Iran’s nuclear program in exchange for the lifting of some of the crushing economic sanctions the U.S. has imposed on the Islamic Republic, closing in on half a century of enmity. The President has repeatedly threatened to unleash airstrikes targeting Iran’s program if a deal isn’t reached. Iranian officials increasingly warn they could pursue a nuclear weapon with their stockpile of uranium enriched to near weapons-grade levels. “Iran almost certainly is not producing nuclear weapons, but Iran has undertaken activities in recent years that better position it to produce them, if it chooses to do so,” a new report from the U.S. Defense Intelligence Agency said. “These actions reduce the time required to produce sufficient weapons-grade uranium for a first nuclear device to probably less than one week.” However, it likely still would take Iran months to make a working bomb, experts say. Enrichment remains the key point of contention. Witkoff at one point suggested Iran could enrich uranium at 3.67%, then later began saying all Iranian enrichment must stop. That position on the American side has hardened over time. Asked about the negotiations, State Department spokesperson Tammy Bruce said “we believe that we are going to succeed” in the talks and on Washington’s push for no enrichment. “The Iranians are at that table, so they also understand what our position is, and they continue to go,” Bruce said Thursday. One idea floated so far that might allow Iran to stop enrichment in the Islamic Republic but maintain a supply of uranium could be a consortium in the Mideast backed by regional countries and the U.S. There also are multiple countries and the International Atomic Energy Agency offering low-enriched uranium that can be used for peaceful purposes by countries. However, Iran’s Foreign Ministry has maintained enrichment must continue within the country’s borders and a similar fuel-swap proposal failed to gain traction in negotiations in 2010. Meanwhile, Israel has threatened to strike Iran’s nuclear facilities on their own if it feels threatened, further complicating tensions in the Mideast already spiked by the Israel-Hamas war in the Gaza Strip. Araghchi warned Thursday that Iran would take “special measures” to defend its nuclear facilities if Israel continues to threaten them, while also warning the U.S. it would view it as being complicit in any Israeli attack. Authorities allowed a group of Iranian students to form a human chain Thursday at its underground enrichment site at Fordo, an area with incredibly tight security built into a mountain to defend against possible airstrikes. Talks come as U.S. pressure on Iran increases Yet despite the tough talk from Iran, the Islamic Republic needs a deal. Its internal politics are inflamed over the mandatory hijab, or headscarf, with women still ignoring the law on the streets of Tehran. Rumors also persist over the government potentially increasing the cost of subsidized gasoline in the country, which has sparked nationwide protests in the past. Iran’s rial currency plunged to over one million to a U.S. dollar in April. The currency has improved with the talks, however, something Tehran hopes will continue as a further collapse in the rial could spark further economic unrest. Meanwhile, its self-described “Axis of Resistance” sits in tatters after Iran’s regional allies in the region have faced repeated attacks by Israel during its war against Hamas in the Gaza Strip. The collapse of Syrian President Bashar Assad’s government during a rebel advance in December also stripped Iran of a key ally. The The President administration also has continued to levy new sanctions on Iran, including this week, which saw the U.S. specifically target any sale of sodium perchlorate to the Islamic Republic. Iran reportedly received that chemical in shipments from China at its Shahid Rajaei port near Bandar Abbas. A major, unexplained explosion there killed dozens and wounded over 1,000 others in April during one round of the talks. Gambrell reported from Dubai, United Arab Emirates. Associated Press writer Nasser Karimi in Tehran, Iran, contributed to this report. —Jon Gambrell and Giada Zampano, Associated Press View the full article

-
Shopping has always been a battle. Companies work hard to convince you that their product is better, while also trying to ensure you pay the highest possible price for your purchase. That’s fair enough, and most of us are accustomed to researching everything we buy to make sure we’re not being ripped off. But modern technology has changed the game. Companies have been hoovering up information about us for years now, and that means they have a pretty good idea about our shopping habits—including what we’re willing to pay for specific products and services, something called Individualized Consumer Data (ICD). New tools like artificial intelligence are now making it very, very easy for companies to engage in what’s known as surveillance pricing. What is surveillance pricing?As its most basic, surveillance pricing is when companies put together a profile of you and your shopping habits, then adjust prices specifically for you. A basic example would be shopping for a television: Two people go to Amazon to look at the same television. One person sees a price of $499, while the other sees $599—for the exact same television, at the exact same moment. The discrepancy is due to their different spending habits and other information that Amazon has gathered about them—their ICD—that tells the company that one person would be willing to spend that extra $100, and the other wouldn’t. Companies create those profiles by scraping an incredibly large volume of information about you from a wide variety of sources. Internet cookies, your shopping history, your IP address (and the geographic and demographic information it provides), are just the basics—the profiling goes much deeper. Even behaviors like how far you scroll when searching for products or what you leave in your shopping cart and never buy contribute to a detailed picture of who you are as a consumer. You might be thinking that most of your personal and financial information is protected to some extent by privacy laws and policies, and you would be right. A lot of this stuff is anonymized. But the sheer amount of information that you leak when you go online—not just cookies and IP addresses, but the browser you use, the plugins you have installed, your time zone, screen size, devices, even system fonts on your computer—can be collected to create a detailed “fingerprint” of your online life. Combined with data gathered from loyalty apps and other sources, this means that an “anonymous” profile of you can be reliably created and identified. In other words, companies may not know that it’s you shopping for that TV, but they know that a unique consumer with specific habits is shopping for one, and thus they can tweak their pricing as needed very effectively. The signs to look out forWhat’s fun about surveillance pricing is how hard it is to tell it’s happening. After all, you surf to a site to buy something, you see a price, you assume that’s just the price that’s been calculated. How can you know that someone else will see a higher or lower price? It’s not easy. You can look for a few subtle signs and try a few experiments if you suspect you’re running into surveillance pricing: Changed prices. If you go back to a specific website regularly and notice that the price changes, it might be because you’re using a different device or because some other aspect of your online fingerprint has changed. Or it might be because your ICD tells the company that you always visit multiple times looking for a lower price. Inconsistent pricing. If you know someone who is shopping for the same item on the same platform and they’re getting different pricing, that’s a potential clue. Reactive advertising. Even if you haven’t noticed price changes, seeing ads that are narrowly targeted to you can be a sign that ICD is being collected and used on you. For example, if web searches or comments on your social media channels seem to inspire related ads, there’s a good chance that your online fingerprint is specific enough to be used for surveillance pricing. Defending against surveillance pricingSurveillance pricing is harmful to consumers because it means you wind up paying more for items simply because of where you live or other extraneous factors—it’s inherently unfair. Defending against it, however, can be challenging—there are basically four strategies you can employ against surveillance pricing, and none of them are magic bullets. Comparison shopThe simplest way to combat suspected surveillance pricing is to shop around for items at different stores—including physical locations, if possible—to get a clear idea of what the “normal” price should be. This can be time-consuming and not always effective, as different online platforms may all use similar surveillance techniques against you. Another aspect of this is to engage your friends and family who live in different areas and use different devices (Android phones versus iPhones, for example). A news station recently had several people from around the country check the prices of different products online, and found prices swung by several hundred dollars depending on location and other factors. If you can ask people who live in different areas to check prices, you can at least determine if you’re getting an okay deal, comparatively. Use a VPNOne of the most common pieces of advice whenever pricing issues come up is to use a Virtual Private Network (VPN) to mask your location—you’ve probably seen this advice in conjunction with finding the lowest airline prices for trips. It seems to make sense: If retailers are charging more for people living in affluent zip codes, changing your reported location should defend against that. I tried this, using a VPN to change my IP address to locations in Mexico, the Netherlands, Japan, and different areas of the U.S., and actually saw no price changes whatsoever. One reason this might not work is because your IP address and associated location are just one piece of your online fingerprint, and companies can still track you when you mask it (your browser gives away a lot of information—you can see just how much at this site). Another reason this might not work as well as you expect is because companies can pretty easily tell that you’re using a VPN because the IP addresses they assign their users are used over and over again, often by several people at the same time. This creates patterns that allow companies to flag those IP addresses as VPNs. However, that doesn’t mean that using a VPN is pointless in the fight against surveillance pricing. If you routinely surf the net behind a VPN and combine that with other steps like incognito browsing, regularly clearing cookies from your browser, and deleting your internet history, you deny trackers a wealth of information about you, which can help cloak your identity, making it harder to create that online fingerprint. Avoid loyalty appsLoyalty apps that offer coupons and discounts to regular shoppers are, of course, data vacuums that make it very easy to create a profile about you and your shopping habits. For a few measly discounts, you’re basically giving companies everything they could possibly need to track and profile you—and they can (and do) sell that information to other retailers. If you want to make it harder for them to use surveillance pricing against you, giving up those little perks is probably necessary. Use different devicesThe final piece of advice for defeating surveillance pricing is the one thing that did actually make a difference when I tested it. I randomly searched Amazon for a 65-inch TV made by TCL. On my desktop browser, it was listed at $469.95. When I switched to my phone, it was suddenly $479.00. Less than $10 isn’t a huge difference, but changing devices was the only strategy that yielded any results at all for me, and indicates that checking prices on different devices is an effective strategy for ensuring you’re getting the best possible price despite what your profile might say about your shopping habits. Of course, all of this checking and device-swapping takes time and effort, so you have to consider whether the money you might save by getting around surveillance pricing is worth the time you put into it. Using a VPN with an incognito browser regularly is probably the best passive strategy you can employ to frustrate attempts to profile you without making it into a second job. Last year the Federal Trade Commission opened an investigation into surveillance pricing, which could lead to new rules and enforcement to end the practice, and several states have some kind of legislation to regulate or ban the practice in the works. But until those become reality, keep your eyes open. View the full article
-
There’s a quiet transformation underway in how we eat. It’s not being led by chefs, influencers, or climate activists. It’s being driven by a new class of pharmaceuticals that are changing the way millions of people relate to food itself. GLP-1 drugs like Ozempic and Wegovy work by altering hunger signals in the brain. These medications don’t just help people feel full sooner. They are reshaping consumption patterns across the board. When hunger changes, everything from portion sizes to snacking habits and flavor preferences follows. This is fueling a broader redefinition of how we think about protein. What used to be a food category mostly associated with muscle-building or dieting is now at the center of a cultural and metabolic shift. We’re entering a new phase where people are eating less but expecting more from what they do eat. That’s why protein is showing up in unexpected places—pasta sauces, pancake mixes, condiments, even mustard. Yes, protein mustard. Some of this feels like marketing gone rogue. (How much seasoning do I need to eat before it impacts my protein intake?) But the underlying trend is real. People want smaller portions with higher impact. This shift disrupts the conventional thinking that indulgent foods (hamburgers, ice cream, chocolate) must inherently lack nutritional value, while healthier options (kale salads or plain tofu) can’t offer true enjoyment. GLP-1 breaks down this barrier, emphasizing the need for indulgence and nutrition to coexist. This shift is especially visible in the snack aisle. A recent Wall Street Journal article spotlighted how protein-rich snacks are rising in popularity as consumers seek satiety and nutrition in smaller formats. This isn’t about indulgence anymore. It’s about optimization. At the same time, the definition of protein itself is evolving. New formats are emerging, from refined plant-based offerings to fermentation-derived and cultivated proteins. At Aleph Farms, the cultivated meat company I lead, we designed a product that is right-sized for the GLP market. Our first Aleph Cut is called a “Petit Steak,” which is smaller and thinner. These aren’t just replacements for conventional meat. They are recalibrations, designed for consumers who want fewer bites, but better ones. Even pharmaceutical companies are taking notice. Novo Nordisk, maker of Ozempic and Wegovy, recently funded research into less-processed plant proteins at the University of Copenhagen. It’s a strong signal that food innovation is starting to orbit around a new gravitational center: changed appetites. For the food industry, this isn’t just about cutting portion sizes or slapping “high protein” on a label. It’s about rethinking what protein can mean when hunger looks different. Can it be lighter and still satisfying? Can it be more sustainable without losing its emotional resonance? Can it become something people seek out, not for fullness, but for fulfillment? In the GLP-1 era, people aren’t eating to feel full. They’re eating to feel nourished, energized, and in control. So the real question isn’t “how much protein does this product contain?” It’s “how does this protein earn its place?” View the full article

-
With millions of drivers preparing to hit the road for Memorial Day weekend, gas prices have remained stable nationwide, providing welcome news for travelers. According to AAA, the national average for a gallon of regular gasoline holds at $3.19, unchanged from the previous week and significantly lower than one year ago, when prices stood at $3.61. AAA reported on May 22 that current prices represent the lowest Memorial Day average since 2021, when the national average was $3.04 per gallon. Experts attribute the stability to a supply surplus in the crude oil market, with production outpacing demand. The latest data from the Energy Information Administration (EIA) shows a slight decline in gasoline demand, dropping from 8.79 million barrels per day (b/d) last week to 8.64 million b/d. Meanwhile, domestic gasoline supply rose to 225.5 million barrels, up from 224.7 million, and production also climbed, averaging 9.6 million b/d last week. While pump prices have remained mostly flat this year, AAA noted this steadiness is unusual compared to previous years. This trend, they say, is being driven by current oil market dynamics. At the close of Wednesday’s trading session, West Texas Intermediate (WTI) crude oil fell 46 cents, settling at $61.57 per barrel. Crude inventories rose by 1.3 million barrels, reaching 443.2 million barrels, which is still 6% below the five-year average for this time of year. Gas prices vary significantly by state. The most expensive gasoline markets in the U.S. are: California – $4.87 Hawaii – $4.49 Washington – $4.38 Oregon – $3.99 Nevada – $3.93 Alaska – $3.64 Illinois – $3.44 Arizona – $3.37 Idaho – $3.32 Pennsylvania – $3.31 Meanwhile, the least expensive states for gasoline include: Mississippi – $2.66 Louisiana – $2.71 Alabama – $2.74 Tennessee – $2.77 Texas – $2.78 Arkansas – $2.80 South Carolina – $2.81 Oklahoma – $2.81 Kentucky – $2.85 Missouri – $2.87 Electric vehicle (EV) drivers also saw stable prices. The national average per kilowatt hour (kWh) at public EV charging stations held at 36 cents over the past week. AAA provided a breakdown of EV charging costs across states, showing continued disparities. The most expensive states for public EV charging per kWh are: Alaska – 51¢ West Virginia – 49¢ Tennessee – 48¢ Hawaii – 46¢ Montana – 45¢ Louisiana – 44¢ New Hampshire – 42¢ South Carolina – 42¢ Arkansas – 42¢ Kentucky – 42¢ The least expensive states for EV charging include: Kansas – 25¢ Missouri – 27¢ Maryland – 28¢ Delaware – 29¢ Nebraska – 30¢ Utah – 30¢ Iowa – 32¢ Massachusetts – 32¢ New Mexico – 33¢ District of Columbia – 33¢ This article, "Gas Prices Steady Ahead of Memorial Day Weekend, Offering Relief to Holiday Travelers" was first published on Small Business Trends View the full article
-
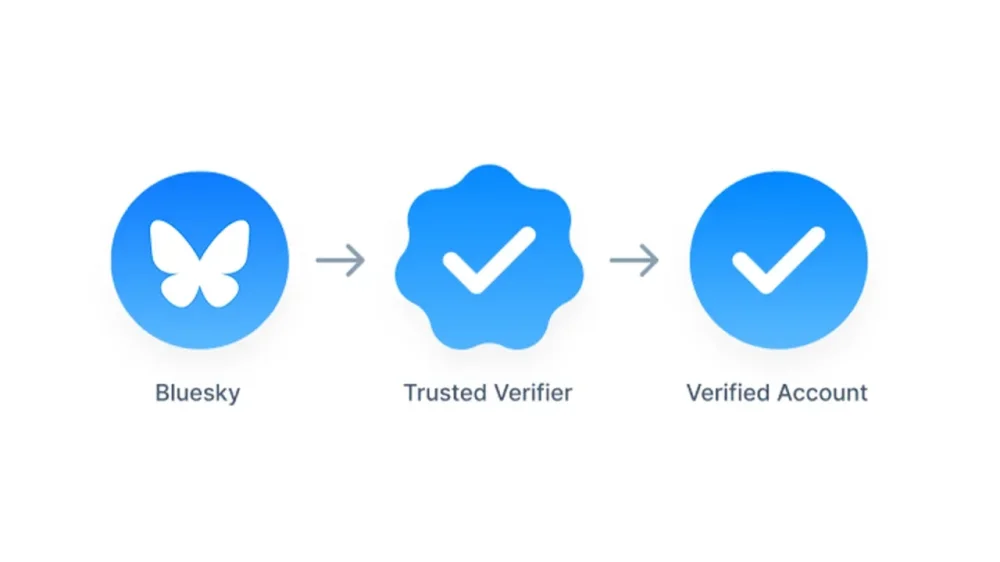
Blue-check verification is nothing new in the world of social media, but Bluesky is only now making it available to any “notable” accounts. The social media company has launched an application that allows users to apply for this authentication and receive a blue check. Bluesky first launched a form of verification in 2023 that required users to put a domain as their handle. For example, a brand or magazine could show its validity by using its official website as an identifier. Meanwhile, individuals who worked for the company could then make their usernames @name.wesbite.com. According to Bluesky, over 270,000 accounts took part in this option over its first two years. It wasn’t until this April that Bluesky hopped on the train of its competitors and started offering blue checks—and very selectively. Most notably, it introduced a process allowing approved organizations to become Trusted Verifiers and give their employees a blue check. These users receive a scalloped blue check indicating their “trusted” status. That brings us to the present day, when Bluesky’s safety account announced, “We’re expanding our roll-out. Notable and authentic accounts can apply for verification or to become a Trusted Verifier via the form linked in our blog.” How can I apply for Bluesky verification? The application is available here and includes questions about what category the account falls under (such as a public figure or elected official) and what proof is available regarding its status. Accounts not selected for verification won’t receive a response from the company, however, they can still pursue the domain option. Bluesky’s usership exploded following a mass exodus from X after the presidential election—tripling in size since its pre-November numbers to over 36 million users at the time of publication. X’s owner, Elon Musk, had already begun offering paid verification, removing the validity of such designations on the site by not making it clear who’s legit and who shelled out. His financial and vocal support of now President The President pushed more users to delete their accounts and migrate to Bluesky. View the full article
-
Police are dragged into investigating petty incidents, undermining trust in our freedom to express opinionsView the full article
-
It’s the Friday open thread! The comment section on this post is open for discussion with other readers on any work-related questions that you want to talk about (that includes school). If you want an answer from me, emailing me is still your best bet*, but this is a chance to take your questions to other readers. * If you submitted a question to me recently, please do not repost it here, as it may be in my queue to answer. The post open thread – May 23, 2025 appeared first on Ask a Manager. View the full article
-
Even the most meticulously planned projects experience unforeseen changes, and when this happens, we need to quantify the effect these changes have. Luckily, there are formulas that eliminate the guesswork. One of these formulas solves for Estimate at Completion — an important metric for monitoring a project budget. Keep reading to learn why to always calculate Estimate at Completion and exactly what this formula can do. What Is Estimate at Completion (EAC)? Estimate at completion (EAC) is a part of the earned value management (EVM) system. This term refers to the practice of re-estimating the total cost of the project during the project execution phase. In other words, EAC allows project management teams to forecast how much the project will cost at the time of completion based on its actual costs, which are likely different from the costs in the project budget made in the initiation or planning phase. Once calculated, the EAC can then be compared to the originally projected budget to determine if the project is likely to be finished within budget based on current performance. Unlike other methods of cost estimation, an estimate at completion calculation considers actual performance at any given moment of the project execution phase and recognizes that initial budget projections are likely not perfect. For this reason, it is often referred to as a “project forecasting tool or method” /wp-content/uploads/2020/09/Project-Budget-Template-for-Excel.png Get your free Project Budget Template Use this free Project Budget Template for Excel to manage your projects better. Download Excel File To fully understand the role EAC plays in the earned value management system, we have to look at other parts of this system and how EAC is unique. Because of the dynamic nature of EAC, there is no single formula to calculate the estimate at completion of a project, as you can use several formulas depending on how the project is progressing. But before we get into that, it’s important to define the variables that are used to calculate EAC. Estimate at Completion (EAC) Definitions The estimate at completion formula consists of variables and concepts that are part of the Earned Value Management system. But what exactly do these terms mean and how do you find them? Budget at Completion (BAC): Budget at Completion (BAC) refers to the entire budget required to complete a project. In order to find BAC, you must add all estimated costs and expenses. Generally, budgets are broken down categorically. BAC is the sum of all the categories. Cost Performance Index (CPI): Cost Performance Index (CPI) is a ratio representing how costs are being turned into actual work; how effectively is money being spent. This is found by dividing the earned value (EV) of work completed by the Actual Cost (AC) it took to perform. Schedule Performance Index (SPI): Similar to CPI, the Schedule Performance Index measures how efficiently time is being spent. SPI is calculated by dividing the Earned Value (EV) of work done by the Planned Value (PV). Estimate to Complete (ETC): ETC forecasts the expected cost to complete the remaining project work. It helps project teams determine how much more funding is needed, either by subtracting actual costs from the EAC or through a new bottom-up estimate. Actual Cost (AC): AC represents the total cost incurred for completed work up to a specific point in time. It is used in Earned Value Management to assess how much has been spent compared to the value of the work performed. Budget at Completion (BAC): BAC is the total budget originally approved for the entire project. It serves as the financial baseline and is used to measure cost performance and forecast deviations from planned expenditures throughout the project life cycle. Earned Value (EV): EV is the budgeted value of work actually completed at a given point in time. It quantifies progress in financial terms and is essential for calculating cost and schedule performance in Earned Value Management. Planned Value (PV): PV is the authorized budget assigned to scheduled work. It reflects how much of the budget should have been spent based on the project schedule and is used to evaluate whether the project is on track. Additional Estimate at Completion Formulas Estimates at completion can also be calculated in three other ways, and each of the variations is best for a certain situation. This formula should be used when the difference between the estimated budget and actual costs will be different in the future than it is in the present: Estimate at Completion = Actual Cost + (Budget at Completion – Earned Value) This formula is the best choice when production has been steady and things are running smoothly. Using this formula helps confirm that a project is on track to stay within budget: Estimate at Completion = Actual Cost + (Budget at Completion – Earned Value) When it’s necessary to take project schedule and cost performance into account (how efficiently time and money are being used) to revise a budget, use this formula to find estimates at completion. As you can see, you first need to calculate the Schedule Performance Index and Cost Performance Index. Estimate at Completion = Actual Cost + (Budget at Completion – Earned Value) / Schedule Performance Index + Cost Performance Index How to Calculate Estimate at Completion: Estimate at Completion Formulas Here are the formulas used to calculate the estimate at completion of a project. Each of them allows project management teams to estimate how much a project will cost at the end, but are slightly different to accommodate various scenarios. 1. EAC = BAC/CPI We’re happy to report that the most commonly used estimate at completion formula is fairly simple! In order to calculate the estimate at completion (EAC), you must know the budget at completion (BAC) and the cost performance index (CPI). With this information, the calculation is as simple as dividing the two. Below is what that estimate at completion formula looks like in more detail: Estimate at Completion = Budget at Completion / Cost Performance Index This formula assumes that the cost performance seen so far will continue throughout the rest of the project. It’s used when the project is stable and trends in cost efficiency are expected to remain consistent. Because it directly factors in the Cost Performance Index (CPI), it’s best for projects with predictable spending patterns and no major disruptions. It allows teams to adjust expectations without re-estimating each task, making it ideal for consistent, ongoing performance evaluation. 2. EAC = AC + (BAC – EV) This formula is the best choice when production has been steady and things are running smoothly. It assumes that past cost overruns or inefficiencies were one-time events, and the remaining work will be completed as originally budgeted. It’s most useful when early cost variances are not expected to continue and the original plan still holds for future work. Below is what that estimate at completion formula looks like in more detail: Estimate at Completion = Actual Cost + (Budget at Completion – Earned Value) This formula does not adjust for ongoing performance trends, so it’s best used when there’s confidence that the baseline plan is still realistic. It’s a conservative forecast based on reverting to the initial budget. 3. EAC = AC + [(BAC – EV) / (CPI × SPI)] This estimate at completion formula should be used when it’s necessary to take project schedule and cost performance into account (how efficiently time and money are being used) to revise a budget. It adjusts for both cost and schedule performance, assuming that future work will be influenced by current inefficiencies in both areas. It’s especially valuable for troubled or complex projects where delays and overspending are occurring together. Below is what that estimate at completion formula looks like in more detail: Estimate at Completion = Actual Cost + [(Budget at Completion – Earned Value) / (Schedule Performance Index * Cost Performance Index)] By incorporating both the Cost Performance Index (CPI) and the Schedule Performance Index (SPI), it produces a more comprehensive forecast. It’s best used when neither cost nor time trends can be ignored, and recovery requires simultaneous attention to both factors. 4. EAC = AC + Bottom-up ETC This approach assumes that the original plan is no longer valid, and a new estimate must be built from the ground up. It’s used when significant changes in scope, unexpected challenges, or shifts in project direction occur. Below is what that estimate at completion formula looks like in more detail: Estimate at Completion = Actual Cost + Bottom-up Estimate to Complete Instead of relying on performance indices, this method involves a detailed reassessment of remaining tasks and costs. It’s best for projects requiring a fresh financial outlook due to poor initial planning, changing requirements, or disrupted performance metrics that render previous estimates unusable. Estimate at Completion Example For this example, we’ll use the first Estimate to Complete formula variation. As a reminder, here’s what that equation looks like: EAC = BAC / CPI In this scenario, the Budget at Completion (BAC) is $50,000 and the current Cost Performance Index (CPI) is equal to 0.8. Therefore, we must divide $50,000 by 0.8. EAC = $50,000 / 0.8 EAC = $62,500 This result indicates that at the current moment, the project is estimated to cost $62,500, which is $12,500 over the initial budget. Estimate at Completion vs. Estimate to Complete These two terms are often mixed up, because they both refer to estimates on some aspect of a project budget. Because they are so easily confused, it’s key to know the difference and when to calculate for which. Estimate at completion (EAC) predicts total costs, while estimate to complete (ETC) predicts the money a project still needs. ETC is the forecast of all additional money required to complete a project. It does not account for money already spent. Estimate at Completion vs. To Complete Performance Index (TCPI) The term “to complete performance index” (TCPI) refers to how cost-efficient the rest of a project must be in order to complete the final deliverable. This is a subset of a cost performance index (CPI). A CPI shows how efficiency costs and resources are being used in the present. When we solve for CPI, the answer will be less, greater or equal to one, depending on how costs compare to the amount of work completed. If, for instance, CPI is less than one, changes need to be made in order to be more cost-efficient. When this is the case, you will solve for TCPI to find a numerical value representing how much this adjustment needs to be. That formula looks like this: TCPI = (Budget at Completion (BAC) – Earned Value (EV)) / (BAC – Actual Cost (AC)) Why Is it Important to Calculate the Estimate at Completion of a Project? Even the most well-planned budgets aren’t always 100% accurate. Projects are prone to changes and unexpected circumstances, including increased or decreased expenses and costs. Calculating EAC gives project managers the opportunity to track exactly how much a change will impact the total budget — in a dollar amount. Knowing this exact dollar amount makes for better, more informed decision-making. /wp-content/uploads/2022/03/Dashboard_Construction_Wide_Zoom-150-CTA.jpgLearn more When to Calculate the Estimate at Completion of a Project Estimate at completion is a means of estimating how much a project will cost at the end of the line. But, in order to accurately calculate for EAC, you need to know the cost performance index (CPI). As such, EAC can only be calculated when a project is running. The CPI is calculated at regular intervals during a project, as this number shows spending effectiveness. This makes it a good habit to calculate for EAC anytime the CPI changes. Project Budget Template Before you calculate EAC, you’ll need to create a thorough project budget. This free project budget template for Excel allows you to list all your project tasks and their related costs such as labor, material and equipment. The best part is that it automatically calculates the difference between planned and actual costs to let you know whether your project is over or under budget. /wp-content/uploads/2020/09/Project-Budget-Screenshot.jpg However, while this project management template is useful, it can’t compete with the features of a robust project management software like ProjectManager. How ProjectManager Helps with Cost Estimating and Variance When you’ve successfully calculated the Estimate at Completion, it’s time to put the results to use. In order to make the best estimates, you need to have the most current information. The ProjectManager dashboard updates in real-time, so there’s no chance of using old data to make important decisions for the future. /wp-content/uploads/2022/03/Dashboard_Construction_Wide_Zoom-150.jpg Use a wide range of filters to customize the dashboard view to your liking and hone in on the critical details. See costs, tasks, time spent and overall project health, all from one hub. Let your dashboard do the calculations for you and easily compare things like planned v. actual costs, planned completion v. actual completion and more. That means there’s no need to get out the calculator or rely on third-party applications to see things like your EAC. Related Content Project Estimation Techniques: A Quick Guide Time Estimation in Project Management: Tips & Techniques Calculating Estimate at Completion (EAC) Parametric Estimating In Project Management When creating an estimate at completion for your project, you need the best tools to calculate cost estimations and variance. ProjectManager is a cloud-based project management software with dashboards and resource management features that give you control over your project costs. Try ProjectManager today for free! The post Calculating Estimate at Completion (EAC) appeared first on ProjectManager. View the full article
-
Throughout the life of a project, project managers check in on progress and compare it to the project plan—comparing their predictions to reality. If they don’t do this regularly, odds are the budget will suffer and their project will fail. Luckily, these deviances from the plan, such as cost variance, don’t have to sink a project. In fact, they can strengthen it. The key is spotting them and making adjustments to stay on the right path. One of the best ways to avoid cost overrun is by calculating cost variance. /wp-content/uploads/2021/07/Cost-Benefit-Analysis-Template.png Get your free Cost Benefit Analysis Template Use this free Cost Benefit Analysis Template for Excel to manage your projects better. Download Excel File What Is Cost Variance in Project Management? Cost variance (also referred to as CV) is the difference between project costs estimated during the planning phase and the actual costs. In other words, it’s how much actual costs vary from budgeted costs. Calculating cost variance is how project managers track expenses to see if a project is under or over budget. These calculations are part of a technique called earned value management (EVM). In an EVM system, the goal of cost management is to establish whether a variance is positive, negative or zero. When project managers have this earned value analysis information, they can make the necessary adjustments to stay on track. If a variance is extremely high (negative), changes need to be made. If there’s an extremely low-cost variance (positive) or zero variance, they can take it as a sign of effective cost management. Positive Cost Variance vs. Negative Cost Variance Cost variance (CV) is a key performance metric in project management that measures the difference between the budgeted cost of work performed (earned value) and the actual cost incurred. It helps project managers assess whether a project is under or over budget. Positive cost variance indicates that the project is under budget. This happens when the earned value is greater than the actual cost. For example, if your project has earned $50,000 worth of work but you’ve only spent $45,000, your cost variance is +$5,000. A positive CV suggests efficient cost management and resource use. Negative cost variance means the project is over budget. This occurs when the actual cost exceeds the earned value. For instance, if you’ve completed $40,000 worth of work but spent $45,000, your cost variance is -$5,000. A negative CV flags potential issues such as scope creep, underestimation, or misallocated resources, and usually requires corrective action. Understanding and tracking cost variance is crucial for maintaining financial control and ensuring project profitability. How to Calculate Cost Variance in Project Management Cost variance is exactly how much a project is over or under budget. This is calculated using the cost variance formula. Cost Variance Formula In the earned value management (EVM) methodology used in project management, cost variance (CV) measures the difference between the value of work performed and the actual cost incurred. It is calculated using the formula below, where EV stands for earned value and AC is actual cost. A positive CV indicates under budget; a negative CV signals cost overruns. Cost Variance (CV) = Earned Value (EV) – Actual Cost (AC) Actual Cost (AC): The total cost incurred for work performed on a project up to a specific point. It includes all direct and indirect expenses, such as labor, materials, and equipment, regardless of the project’s progress. Earned Value (EV): The budgeted value of the work actually completed at a given point in time. It reflects project progress in monetary terms and is used to compare planned versus actual performance. Cost Variance Calculation Methods Cost variance calculation methods are techniques used to measure the difference between a project’s planned and actual costs at various points in time. There are three main cost variance calculation methods, cumulative cost variance method, period-by-period cost variance method and variance at completion method. These three methods apply the cost variance formula (CV = EV – AC) at different stages of the project. Cumulative Cost Variance Method The cumulative cost variance (CV) method calculates the difference between the earned value (EV) and actual cost (AC) of a project up to a specific point in time. It reflects the overall cost performance across the entire project duration to date. Formula: CV = EV – AC This method provides a high-level overview of whether the project is under or over budget, making it useful for ongoing budget tracking and trend analysis. It helps stakeholders assess long-term project performance rather than isolated cost issues. Period-by-Period Cost Variance Method The period-by-period cost variance method focuses on short time intervals—typically weekly or monthly—calculating the cost variance for each specific period. Formula (per period): CV = EV (for the period) – AC (for the period) This method allows project managers to pinpoint when cost deviations occur, offering a more detailed and immediate insight into spending issues. It’s ideal for identifying short-term trends or sudden spikes in costs that may not yet be reflected in cumulative data. Variance at Completion (VAC) Method Variance at completion (VAC) forecasts the expected cost variance at the end of the project. It compares the total project budget, known as the budget at completion (BAC), with the forecasted cost, or estimate at completion (EAC). Formula: VAC = BAC – EAC This method helps project managers anticipate whether they are likely to complete the project under or over budget, enabling better long-term financial planning and corrective action before project closure. What Are the Main Causes of Cost Variance In Project Management? Cost variance in project management refers to the difference between the estimated cost and the actual cost of a project. While small variances are expected, significant differences often signal deeper issues that can affect project success. Understanding the root causes of cost variance is essential for controlling budgets, managing expectations and delivering value. Inaccurate Cost Estimates Poor initial cost estimates can derail a project’s financial trajectory from the start. This usually occurs when estimates are based on incomplete data, guesswork, or overly optimistic assumptions. Without thorough research and expert input, budget baselines may not reflect the true scope or complexity of the work. Scope Creep When new features, tasks or deliverables are added to a project without corresponding budget adjustments, it leads to scope creep. This often results from unclear requirements or lack of change control processes. The more the scope expands, the more costs rise—often unexpectedly. Schedule Delays Delays in project timelines can significantly increase costs due to extended resource use, contract penalties or the need to accelerate later work phases. Time-sensitive costs like equipment rentals or staff salaries often become inflated when a project runs behind schedule. Resource Cost Fluctuations The price of labor, materials and subcontractor services can change due to market conditions, availability or external economic factors. If a budget doesn’t account for potential price shifts or inflation, it can cause substantial cost overruns. Project Risks Unexpected events such as regulatory changes, weather delays or technical issues can disrupt progress and incur additional costs. Without a robust risk management plan, projects may struggle to absorb the financial impact of such events. Low Productivity or Resource Utilization Inefficiency When teams aren’t operating efficiently—due to poor training, unclear direction or lack of coordination—project tasks take longer and require more resources. Inefficient resource usage drives up labor costs and affects overall cost performance. Cost Variance Analysis Examples To better understand the concept of cost variance analysis we have created an example in a couple of different industries. This should help to show how the process works in a real-life scenario. Construction Cost Variance Analysis Example This cost variance analysis example is for the construction industry. Here, the project is working on the foundation of an office building. Project: Office Building Construction Task: Foundation Work Planned Value (PV): $80,000 Earned Value (EV): $75,000 Actual Cost (AC): $90,000 CV = $75,000 – $90,000 = –$15,000 Analysis: The foundation work is $15,000 over budget. Although 75 percent of the work has been completed (EV), actual spending exceeded expectations due to unforeseen soil stabilization issues and higher-than-estimated concrete costs. This unfavorable variance highlights a need to revise cost estimates for future phases and assess vendor pricing accuracy. Manufacturing Cost Variance Analysis Example In this cost variance analysis example, we’re dealing with a manufacturing company. They have a run of steel frames that require welding and assembly. Project: Production of 500 Steel Frames Task: Welding and Assembly Planned Value (PV): $60,000 Earned Value (EV): $55,000 Actual Cost (AC): $50,000 Cost Variance (CV) = EV – AC CV = $55,000 – $50,000 = +$5,000 Analysis: The welding and assembly task is $5,000 under budget. Although only 92 percent of the planned work has been completed, the actual cost came in lower due to higher labor efficiency and a bulk discount on welding supplies. This favorable variance suggests strong production performance and potential to reallocate savings to later stages. Understanding Project Costs All projects cost money, regardless of their size, scope or deliverables. We’ve all heard “there’s no such thing as a free lunch.” The same goes for projects – there’s no such thing as a project without costs. These costs come in many different forms, from the cost of materials to simply the cost of doing business (rent, salaries, etc.). It’s the project manager’s job to take all of these costs into account and create a flexible budget. Project costs, no matter the type, need to be properly managed and tracked throughout the life cycle of a project. If project managers don’t keep a close eye on the project, it can be detrimental to the project’s success. Plus, having real-time data access is essential to helping project managers make adjustments. Project management software is foundational in planning and tracking project costs. ProjectManager is award-winning project management software that has the resource-focused tools you need to compare your planned and actual costs in real time. Use our in-depth Gantt chart to set a baseline once you’ve scheduled your tasks, costs and resources. Use it to understand your project costs at a glance and make adjustments as needed in real time. /wp-content/uploads/2022/07/construction-gantt-resources-costs-150-CTA-BUTTON-1.jpgTry it free! Different Types of Project Costs To fully understand project cost variance, it’s helpful to be familiar with the main types of project costs. Take a look at the four you’re most likely to see. Most projects have all four, and each can contribute to overall cost variance: Direct Costs: Think of direct costs as costs that go straight to the project to achieve deliverables. A helpful example of a direct cost is the cost of the material needed to build something. The cost of these materials is going toward creating an end product. Indirect Costs: Indirect costs, on the other hand, go toward funding “behind the scenes” expenses incurred throughout the life of a project. They’re also known as overhead costs. For example, the cost of renting an office space is a common expense fixed overhead. This expense must be paid to complete the project, but it also goes toward supporting other projects. Fixed Costs: Fixed costs are expenses with set prices that aren’t subject to any kind of change. These are dependable costs that will not fluctuate and potentially throw off a budget. Both direct and indirect costs can also be fixed costs (or variable costs). A fixed cost, for example, might look like the flat fee a contractor charges for their services. Variable Costs: Variable costs, on the other hand, are not as predictable. For example, the cost of equipment rental may go up or down depending on the vendor, the demand or how long the equipment is needed. Overhead Costs: Overhead costs are indirect expenses required to run a project or business, such as utilities, rent, and administrative salaries. They support operations but aren’t tied to specific deliverables or tasks. Related: Free Project Budget Template for Excel Other Types of Cost Variance In Project Management and Cost Accounting Besides the cost variance formula that’s used in earned value management, there are other types of cost variance that are used in project management and cost accounting, especially in manufacturing and construction projects. Material Cost Variance (MCV) Material cost variance (MCV) is a key metric in cost accounting and project management used to measure the difference between the expected cost of materials (based on standard costs) and the actual cost incurred. MCV is most useful in manufacturing and construction projects where material expenses make up a significant portion of the total cost. It helps managers identify pricing issues, supplier performance problems, procurement inefficiencies or market-driven cost changes. Material Cost Variance Formula MCV = (SQ × SP) – (AQ × AP) SQ= Standard Quantity SP= Standard Price AQ= Actual Quantity AP= Actual Price Labor Cost Variance (LCV) Labor cost variance (LCV) is a project and cost management metric that measures the difference between the standard cost of labor and the actual labor cost incurred during a project or production cycle. LCV is especially important in labor-intensive industries such as construction, manufacturing, and service-based projects. It is used to monitor efficiency, wage rate fluctuations and workforce productivity. Labor Cost Variance Formula LCV = (SH × SR) – (AH × AR) SH= Standard Hours SR= Standard Rate AH= Actual Hours AR= Actual Rate Overhead Cost Variance Overhead cost variance is a financial metric used to assess the difference between the budgeted (or standard) overhead costs and the actual overhead costs incurred during a project or production period. This metric is particularly useful in environments with fixed budgets and recurring indirect costs, such as in manufacturing plants or large-scale infrastructure projects. Overhead cost variance helps managers understand how well they are controlling indirect spending and can highlight inefficiencies like underutilized facilities, inaccurate cost allocation methods, or unexpected increases in overhead expenses. Variable Overhead Variance Formula VOHV = (SH × SR) – (AH × AR) SH= Standard Hours SR= Standard Rate AH= Actual Hours AR= Actual Rate Fixed Overhead Variance Formula FOHV = Budgeted Fixed Overhead – Actual Fixed Overhead Other Cost Variance Analysis Formulas Used in EVM While the formula explained above is the main one used to calculate cost variance in project management, there are other earned value management (EVM) formulas that can help with cost variance analysis. Cost Performance Index Formula Cost Performance Index (CPI) = Earned Value (EV) / Actual Cost (AC) A cost performance index (CPI) is a metric used to judge how well resources are being used in a project. When solving for a CPI, the value will be one of two things: Less than or equal to 1 (resources are not being used efficiently) Greater than or equal to 1 (resources are being used efficiently) To solve for CPI, you must divide the earned value by actual costs. To Complete Cost Performance Index Formula To Complete Cost Performance Index (TCPI) = (Total Budget – EV) / (Total Budget – AC) Solving for a complete cost performance index (TCPI) is extremely helpful, especially if you’re experiencing a high (negative) project cost variance. A TCPI is an index that shows how resources must be used for the rest of a project to come in under or on budget. To find your TCPI, begin by subtracting your earned value from your total budget. Then, subtract your actual cost from the total budget. Last, divide the first quotient by the second quotient. Free Cost Benefit Analysis Template Before cost variance comes into play, you need to determine if the project expenses are justified. Download our free cost-benefit analysis template for Excel to quickly crunch the numbers and determine if the project makes sense from a cost perspective. Access to this data makes it easy for project managers to determine if a project will be successful. /wp-content/uploads/2021/07/Cost-Benefit-Analysis-Screenshot.jpg How ProjectManager Helps Calculate Cost Variance in Real Time Throughout the life of a project, you’ll want to have each of these cost variance formulas at your disposal. Thankfully, there are cost management tools that make keeping your eye on variances effortless so that you don’t have to manually crunch the numbers. ProjectManager fills formulas with the correct values automatically and prevents any human error that can lead to major budgeting mistakes. Factors like total budget, actual costs, earned values and more are updated in real-time so that you’re always seeing the most current data. /wp-content/uploads/2024/05/Sheet-light-mode-punch-list-construction-custom-columns-costs-hours--1600x875.png Create and manage project budgets, as well as see how actual costs compare to planned costs on the project dashboard. The ProjectManager project dashboard updates automatically, so you’re always looking at the most current figures and make the smartest budgeting decisions. This makes all the difference between spotting cost variances and missing crucial details. Keep your eye on cost baselines, as well as spending and where projects are at in terms of budget. /wp-content/uploads/2023/01/Dashboard-IT-Light-2554x1372-1-1600x860.png Need to share this information with stakeholders? Create a budget report in only a few clicks to keep the team up to speed and making the best decisions together. Having this information at your fingertips and being able to share it is the difference between projects staying on budget and going over budget, which can result in cost overrun and total failure. /wp-content/uploads/2023/01/Reports-Light-2554x1372-1-1600x860.png Calculating cost variance requires project management software robust enough to calculate and organize your data in real time. ProjectManager is online project management software that keeps your project’s costs within budget. Try it today with this free 30-day trial. The post How to Calculate Cost Variance for a Project (Formula Included) appeared first on ProjectManager. View the full article
-
The top female loan originator in the mortgage industry logged $186.5 million in dollar volume over the course of 2024. View the full article

-
You may not have heard of Anthropic CEO Dario Amodei, but he’s one of a handful of people responsible for the current AI boom. As VP of Research at OpenAI, Amodei helped discover the scaling laws that project how much smarter an AI gets when given increasing amounts of computing power. He holds PhDs in physics and neuroscience and is probably a genius. Amodei, who left OpenAI in 2021 to found Anthropic, which claims to be a more safety-conscious AI company and is now valued at $61 billion after closing its latest funding round, spoke at Anthropic’s developer day in San Francisco Thursday. He’s quirky, refreshingly frank, and often funny. Here are some of his spicier quips. On the science and art of training state-of-the-art AI models: “There is this somewhat superstitious process of model development; it somehow comes together all at the last minute . . . There’s that alchemy that happens at the very last. It doesn’t make any sense. The training process is uniform. You would think that it doesn’t work that way, that it’s all a rational process, but it’s absolutely not.” On the speed at which AI models are moving toward equaling or exceeding human intelligence in a broad range of tasks. “It’s only going to be a year or two until these things are basically going to be peers to us.” On how it feels to be immersed in an accelerating process of creating progressively smarter models. “It’s like being on a spaceship headed away from earth and experiencing larger and larger time dilation constants.” On whether Amodei, who is a neuroscientist, has been inspired by the human brain to create better AI models. “It’s not like I’ve found this thing from the hypothalamus that we can use for making models. It’s all been pretty much from scratch.” On when he thinks the world will see the first billion-dollar company with one employee. “2026” On whether people haven’t yet reckoned with the changing economics of software development brought about by new AI coding agents. He says new agents, like Claude Code, will shorten development time and lower the cost of creating new software. “I think the world is going to be very different when these things can be made on an ad hoc, one-off basis in a few seconds for less than a dollar.” On what Anthropic is doing to stop AI models from hallucinating facts or making mistakes. “It’s really amazing that somehow human beings have managed to never have been mistaken. No one ever makes anything up. I’ve never seen anybody on TV, never seen politicians say things that aren’t true.” On the predicament where people create new companies based on ideas that aren’t yet supported by current AI models. Amodei says it’s good to struggle with the creation of the company until the AI becomes available. “Hitting your head against the wall can actually sometimes be useful.” On what he’s most excited about in the next five years. “I hope that in five years we will have vanquished a lot of the diseases that now exist.” View the full article

-
We may earn a commission from links on this page. Deal pricing and availability subject to change after time of publication. If you want to begin coding—either for a career shift, a hobby, or just to better understand your favorite apps—this bundle is worth a look. You can get Microsoft Visual Studio Professional 2022 bundled with the Learn to Code Certification course pack currently on sale for $55.97—a steep markdown from its original $1,999 price tag. The standout here is that you’re not just getting a license for Visual Studio, which is already a powerhouse development environment, but also lifetime access to more than 60 hours of beginner-to-advanced coding instruction. Visual Studio Pro 2022 itself is widely used in professional environments. It’s built for serious dev work—think C#, Python, .NET, and more. You get tools like IntelliCode for AI-assisted coding suggestions, built-in Git support, debugging, and advanced testing features useful whether you're building a small app or working on enterprise-level projects. Normally, licenses for just the IDE can get expensive, so getting it bundled with a full curriculum covering JavaScript, React, Python, CSS, and more is the kind of package that feels designed for someone starting out with ambition or a side hustle in mind. That said, this is a very Microsoft-centric deal. If you’re aiming to become a Mac-based developer or work heavily with Xcode and iOS projects, this probably won’t be your best fit. The same goes if you’re already deep into development and just looking for a few advanced certifications—some of the coursework may feel too foundational. But if you’ve been stuck in tutorial limbo, this bundle provides structure, software, and real-world tools at a reasonable price. For under $60, it’s hard to beat the value, especially for learners who want both a development platform and a guided roadmap in one place. View the full article
-
You’ve got your hands on the innovative 360 Meeting Owl technology, and you’re ready to take your hybrid meetings to the next level. Whether you're setting up in a classroom, a conference room, or your home office, Meeting Owl pairing can substantially improve the way your team collaborates. And the best part? It’s easier than you think! View the full article
-
More than a fifth of all EU goods exports are to the US marketView the full article
-
Purchases of new single-family homes increased 11% last month to a 743,000 annual rate, the highest level since February 2022, according to government data. View the full article

-
The euro should be developed more as a haven asset for times of market stressView the full article
-
We may earn a commission from links on this page. Deal pricing and availability subject to change after time of publication. If you want to level up your home security, the Arlo Essential 2K Outdoor Camera is now 50% off. For $49.99, this indoor and outdoor camera features high-definition footage, thanks to its 2K video resolution, allowing you to get a clear view of license plates, faces, and more. It also provides peace of mind with nighttime surveillance, featuring an integrated spotlight for color night vision that operates in low-light conditions. Arlo Essential 2K Outdoor Camera $49.99 at Amazon $99.99 Save $50.00 Get Deal Get Deal $49.99 at Amazon $99.99 Save $50.00 A motion detection feature works in real-time and sends notifications to your connected device, keeping you up to date on any alerts. The motion detection feature is rated highly, as is the video quality, which reviewers describe as sharp and crisp. A two-way mic and speaker allow you to listen and speak to visitors through the camera using the Arlo app, where you can also switch between modes such as “Home” or “Away.” It works seamlessly with most smart home systems, including Alexa, Apple, Google Assistant, IFTTT, and SmartThings. While it’s advertised for outdoor usage, it can also be used indoors. But unlike the Arlo indoor camera, its IP65 water-resistant design makes it durable and allows it to withstand various weather conditions, including rain or extreme temperatures. That said, it may experience issues or lag in extremely cold conditions, but this is a common issue with most outdoor cameras. Amazon reviewers appreciate the ease of installation, which is completely wireless and comes with all installation tools included. The camera uses a rechargeable battery, offering flexibility in placement. Still, there are a few drawbacks. Some features are locked behind a monthly membership, and there are mixed reviews regarding the battery life, with some individuals stating that it drains quickly. Based on the location where you install it, it may be inconvenient to take it down for frequent recharging. At full price, having features locked behind a monthly membership might not be worth the cost. Still, given the 50% discount, the camera’s performance and reliability make it a smart choice for those seeking a versatile outdoor security solution. View the full article
-
Stakeholders are the people, groups or organizations that have a key interest in the outcome of a project. They can include department heads, investors, manufacturers, board members or simply team members. They are typically involved in the approval process and can either make a project difficult or extremely easy—depending on how well they’re managed via a stakeholder management plan. In fact, certain stakeholders decide if there should be a project at all, and whether or not the project was a success. They have that much power. Given their influence, it’d be unwise to neglect your stakeholder management plan. But first, let’s review the aspects of good stakeholder management. What Is Stakeholder Management? Put simply, stakeholder management is the concept of managing the stakeholders involved in any major project. Because of how much power they wield, the project manager needs to balance the requirements from key stakeholders with finesse. What are their primary goals with this project? What are they hoping to invest? The more you can tease out what each of their goals and requirements are from the outset, the better. What Is a Stakeholder Management Plan? A stakeholder management plan is a formal document that outlines how an organization will identify, engage and communicate with individuals or groups who have an interest or influence in a project. These stakeholders can include internal team members, clients, investors, regulatory bodies, suppliers and end-users. The project stakeholder management plan, which is part of the overall project plan, ensures that all stakeholder expectations are properly managed and aligned with the project’s objectives, reducing the likelihood of miscommunication or resistance. The process of developing a project stakeholder management plan begins with stakeholder identification and analysis—categorizing each stakeholder by their level of influence and interest in the project. The plan then defines communication strategies tailored to each group’s needs, such as the frequency of updates, preferred channels (e.g., email, meetings, reports) and level of detail required. This helps foster transparency and maintain trust throughout the project lifecycle. In addition to communication planning, the stakeholder management plan also includes strategies for managing stakeholder engagement—especially for those who are highly influential or may be impacted by changes. It helps project managers anticipate stakeholder concerns, resolve conflicts early and keep everyone informed and supportive. By proactively managing these relationships, teams are more likely to meet deadlines, stay on budget and achieve overall project success. What Should Be Included in a Stakeholder Management Plan? A project stakeholder management plan is a crucial part of project planning that outlines how to identify, analyze and engage stakeholders throughout a project’s lifecycle. Its purpose is to ensure that stakeholder needs, expectations and influence are clearly understood and effectively managed. A well-developed stakeholder management plan enhances communication, reduces project risk and improves the chances of project success by keeping stakeholders informed and engaged. 1. Stakeholder Identification Stakeholder identification involves determining all individuals, groups or organizations that could affect or be affected by the project. This early step ensures that no important stakeholder is overlooked and helps tailor engagement strategies to suit different interests and levels of influence. The main tools and techniques that are used to identify key project stakeholders are: Project kickoff meeting: An initial meeting where stakeholders are introduced, and project scope and expectations are discussed to identify key participants. Expert judgement: Leveraging the experience and knowledge of subject matter experts to identify less obvious stakeholders. Stakeholder register: A document or database used to list stakeholders, including their interests, influence and contact information. Brainstorming: A collaborative technique where team members generate ideas to identify potential stakeholders from various project angles. 2. Stakeholder Analysis Stakeholder analysis is the process of assessing each stakeholder’s interests, level of influence and impact on the project. It helps in prioritizing stakeholders and shaping effective communication and engagement strategies. The main tools and techniques that are used to analyze key project stakeholders are: Salience model: A method that categorizes stakeholders based on their power, legitimacy, and urgency. Stakeholder grid: A matrix that plots stakeholders by influence and interest to determine communication strategies. This can be used in various ways, such as a power/interest grid, power/influence grid and influence/impact grid. RACI matrix: A tool used to define stakeholder roles—Responsible, Accountable, Consulted, and Informed—in project tasks. Stakeholder cube: An expanded version of the stakeholder grid that includes a third dimension like attitude or engagement level. Influence diagrams: Visual tools that show the relationships and influence pathways between stakeholders. 3. Stakeholder Engagement Objectives This section outlines the specific goals of engaging with stakeholders, such as keeping them informed, gaining their support or mitigating resistance. These objectives help guide communication tactics and track engagement effectiveness throughout the project. 4. Stakeholder Engagement Strategies These are the customized plans and actions used to achieve the stakeholder engagement objectives. Strategies vary by stakeholder type and might include regular meetings, one-on-one sessions, surveys or public forums depending on their role and influence in the project. 5. Communication Requirements This part defines how information will be shared with stakeholders, including formats, frequencies, channels and responsible parties. Clear communication plans ensure consistency and transparency in stakeholder interactions. 6. Roles and Responsibilities of the Team Clarifying which team members are responsible for stakeholder engagement ensures accountability. This section outlines who will maintain the stakeholder register, manage communications and address stakeholder concerns throughout the project. Stakeholder Management Plan Example This stakeholder management plan example shows how a midsize residential apartment construction project secures cooperation from investors, regulators, contractors and neighbors. Beginning with a stakeholder register that captures each stakeholder’s influence and concerns, the plan progresses through analysis, objectives, tailored engagement tactics, and clear communication protocols. Ongoing monitoring, defined responsibilities, and practical tools ensure that relationships remain productive as the build advances from permitting to handover. The example offers a practical blueprint that teams can adapt to similar construction endeavors. To download this stakeholder management plan example, click the image below. /wp-content/uploads/2019/11/Stakeholder-Management-Plan-Example.png Stakeholder Management Plan Template Creating a stakeholder management plan seems overwhelming, which is why we’ve created an easy-to-use stakeholder management plan template for Word that allows you to gather the most important elements of a stakeholder management plan. You can use it to create a stakeholder management plan like the example above. /wp-content/uploads/2019/11/Stakeholder-management-plan-template-for-Word.png 5 Steps for Writing a Stakeholder Management Plan Because there are many different types of stakeholders, you’ll want a well-rounded stakeholder management plan. Follow these five steps to make sure all of the bases are covered. 1. List Your Stakeholders The first step to any good stakeholder management plan is knowing your stakeholders. They are usually sorted into two groups: internal and external stakeholders. Internal stakeholders are easy to identify. They are typically those within the organization that have a key interest in the completion of a project. They are usually department heads, such as heads of Marketing, IT, Development, Operations and more. These stakeholders can affect the project either directly or indirectly by influencing the direction of their department on the given project. External stakeholders are not typically part of the organization itself but are made up of investors, users/customers, the media, neighboring businesses or governmental oversight authorities. 2. Prioritize Your Stakeholders As we previously mentioned, prioritize which stakeholders are going to have a bigger influence over the project, and also note at which stage their influence becomes lesser or greater. Start by considering how to manage the stakeholders on your project, and then start prioritizing their demands and goals. Understand that those priorities can flex at different project points. For example, at certain points, say, during a website design project, the stakeholder with a special interest in the design will have their goals prioritized. Then, as you move into the development phase, the stakeholders with a special interest in development will have their goals elevated over design. 3. Interview Your Stakeholders Working with new stakeholders can be tricky at the start—some are easier to manage than others. Depending on the type of project, there will either be many voices from outside the company with different personalities and demands, or many voices inside the company with competing goals. Here are some example stakeholder interview questions to ask to get sorted: Why are you interested in this project? What are your expectations for this project? If you have a team involved, what do you expect from them? Which deliverables are you most interested in? What inspired you to get involved in this project? What do you hope this project changes after launch? How quickly do you see this project rolling out? If you feel positively about this project, why? If you have worries about this project, why? Do you prefer in-person meetings, phone meetings or email? You’ll want a solid understanding of whether or not your stakeholders feel positively or negatively about the project, and at what stages their perspectives might shift. Also, identify which ones have a stronger set of views and which ones are more flexible and open to compromise. This will help to mitigate any possible stop gaps down the road. 4. Develop a Matrix A quick mock-up of a quadrant to sort your findings will help you easily distinguish those with high interest, high priority versus low interest, low priority. It will also help to sort all those in between. For example, those with a high interest but a low priority are typically your best confidants. They’re ready to get work done and will cheerlead your project on. Those with low interest and high priority might be your squeakiest wheels—keep the lines of communication open with them, but keep a firm boundary so as to not spend all your time focusing on them. They say the squeaky wheel gets the grease, so remember that even those in the low priority, low interest or high priority, low interest still need to be continually communicated with to ensure that their voices are heard throughout the project. Related: How to Deal with Difficult Stakeholders 5. Set & Manage Expectations Setting and managing expectations is the meat and potatoes of your stakeholder management plan. In fact, it’s the very thing that could make this initiative a success. Once you’ve outlined your matrix and have identified priorities and interests, create your project plan. Clearly identify which stages each key stakeholder will be involved in, and timelines by which their feedback is needed. Include a schedule of office hours for them to easily reach you so that they can have time provide feedback either in a private setting or in a group. As always, be realistic, transparent and honest at every project phase—your stakeholders can tell, and will thank you for it. Making and maintaining a stakeholder management plan is greatly simplified with the help of project planning software. With ProjectManager.com, you can make project timelines with the Gantt, communicate in a central location, attach files to tasks and track progress in real time. All of these factors combine for an easy stakeholder management experience, where everyone stays informed and targets are met. To learn more about how our software can help you, watch the video below: Who Makes the Stakeholder Management Plan? Typically if the entire project—stakeholders and all—are internal, then the project manager is the one that completes the process of a stakeholder management plan. However, if the project is dealing with external stakeholders and an external client, then the primary contact at your client’s organization will be the one to complete this process. Why is a Stakeholder Management Plan Important? No project exists in a vacuum—although that would make any project so much easier to execute. But stakeholders play a key role in making your project happen. They believe in the project and are devoting time, money and resources to your project. Stakeholders help make it an extremely easy process by contributing funds, resources, materials, tools, expertise and more. But without proper management, they can also make it an extremely clunky process with a lot of messy red tape along the way. You know what they say about too many cooks in the kitchen. Communication Benefits Stakeholder management plans are also important from a PR perspective. Consider this—stakeholders don’t work alone; they hear about the project progress from other resources and stakeholders involved. It’s important that their interests are kept intact, and that you don’t find yourself facing the furrowed brow of a frustrated stakeholder who has heard some bad news. Keeping that line of open communication is the most important step to a good stakeholder management plan. Related: Free Communication Plan Template The Risks of Not Having a Stakeholder Management Plan Again, stakeholders make the world go round. They’re your investors, customers, neighbors, producers. They can be your biggest cheerleaders or can make the project slow to a crawl. Since stakeholders usually involve multiple key contacts across many different avenues, it’s important to communicate with them effectively and efficiently. Without having interviewed them ahead of time or gauging their priority or interest, you could end up spinning your wheels trying to validate the requirements of a stakeholder with low priority and low interest, leaving those with a high priority feeling frustrated at the process. Worse yet, you can set your organization up for a lack of funds on the next project or a poor customer experience. Don’t leave your organization vulnerable to a lack of resources, funds or time. What Documentation is Needed? Start with the steps outlined above, and then check in routinely. This can mean weekly, bi-weekly, monthly or quarterly, depending on the project scope or timeline. Document all levels of communication, too. That way, other project members know the latest feedback from key stakeholders and can pivot or include their updated requirements into the project. This will also ease the worries of upper management and keep them posted on the progress of the client and how each stakeholder is coming along. This ensures that even low priority, low-interest stakeholders are getting their fair share of involvement in the project. Free Stakeholder Management Templates We have more than just a project stakeholder management plan template for immediate and free download. There are over 100 free project management templates for Excel and Word that cover all aspects of managing projects. Here are just a few that are related to stakeholder management. Stakeholder Register Template Download this free stakeholder register template for Excel to record essential information about all stakeholders involved in a project. It serves as a central reference to identify, assess and manage the interests, influence, and expectations of people or groups that can affect or are affected by the project. Stakeholder Analysis Template Use this free stakeholder analysis template for Excel to identify and evaluate the individuals or groups that have a stake in a project. It helps assess each stakeholder’s influence, interest, expectations and potential impact on the project, enabling project teams to develop effective engagement and communication strategies. Stakeholder Map Template The free stakeholder map template for Excel is a visual tool used in project management to plot stakeholders based on their level of interest and influence (or power) in a project. It helps project managers and teams quickly identify which stakeholders need the most attention and how to manage communication and engagement effectively throughout the project lifecycle. ProjectManager Can Help with Your Stakeholder Plan The best way to make a stakeholder management plan is with a project management platform where you can execute communication, project planning and more all in one place. With ProjectManager, you’ll get access to dashboards that provide real-time updates and live reporting for stakeholders. Not to mention in-depth project reports, like status reports, variance reports and more that can be customized to give stakeholders exactly the information they need, when they need it. /wp-content/uploads/2024/04/Team-summary-better-data-light-mode-home-screen-dashboard-1600x870.png ProjectManager is an online project management software that gives you everything you need to plan, execute and track your projects. Whether it’s a project plan, resource management plan, stakeholder management plan or simply a task list—ProjectManager.com gives you the tools to succeed. See for yourself and start a free 30-day trial today. The post How to Make a Stakeholder Management Plan appeared first on ProjectManager. View the full article